
World - Thermostats - Market Analysis, Forecast, Size, Trends and Insights
Get instant access to more than 2 million reports, dashboards, and datasets on the IndexBox Platform.
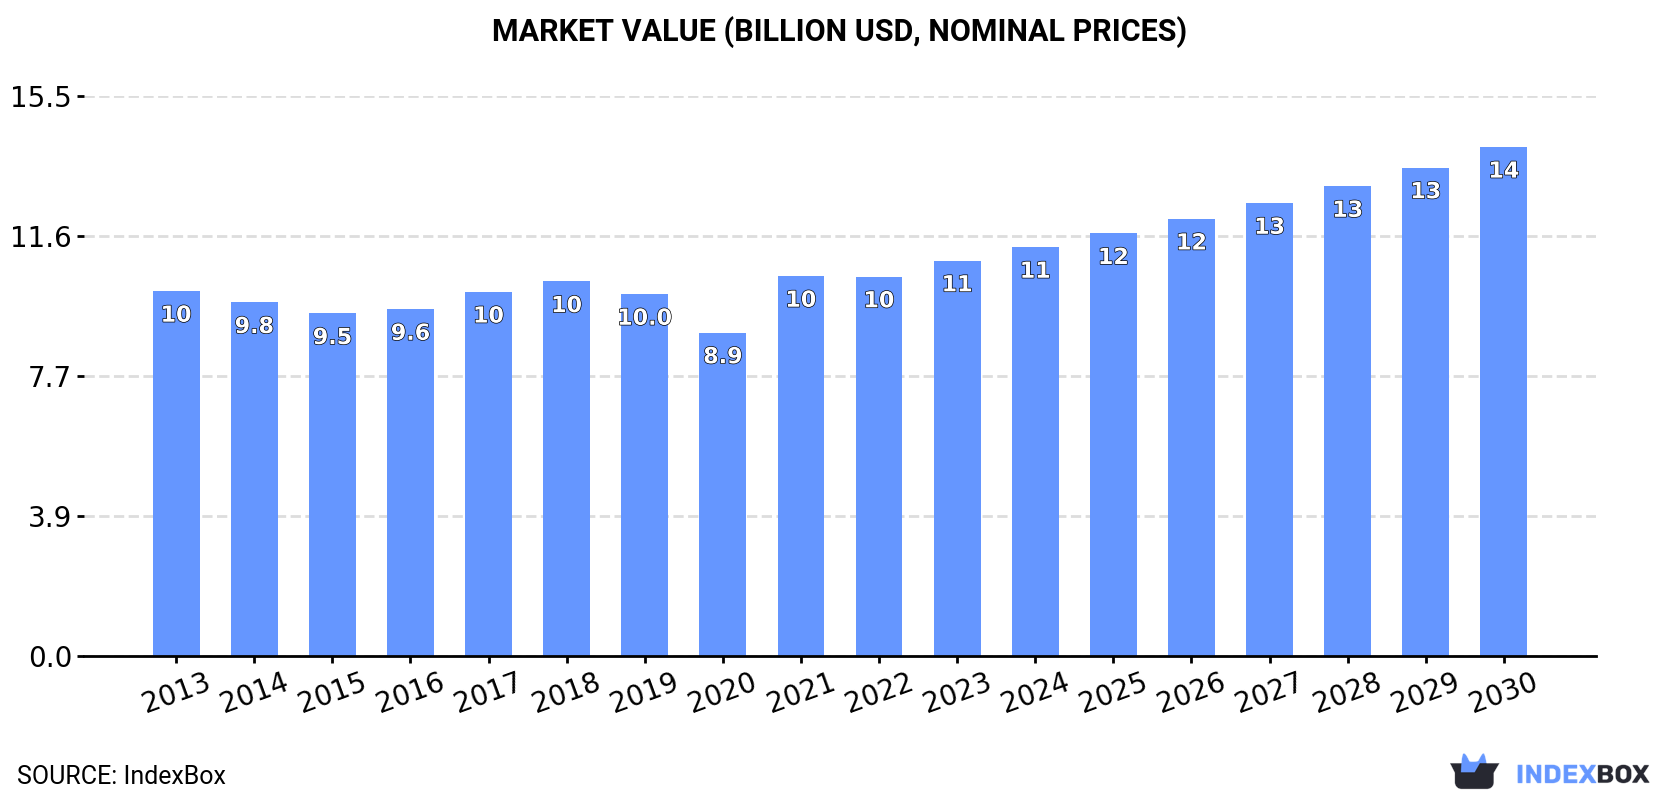
View PricingGlobal Thermostat Market to Reach $14.1B by 2030 with a +3.7% CAGR Growth
IndexBox has just published a new report: World - Thermostats - Market Analysis, Forecast, Size, Trends and Insights.
The global thermostat market is projected to experience steady growth from 2023 to 2030, with a forecasted increase in volume and value. Consumption trends showed a relatively flat pattern, with notable growth in countries like India. Production and import/export figures also point towards a positive outlook for the market.
Market Forecast
Driven by increasing demand for thermostats worldwide, the market is expected to continue an upward consumption trend over the next seven years. Market performance is forecast to accelerate, expanding with an anticipated CAGR of +3.5% for the period from 2023 to 2030, which is projected to bring the market volume to 2.1B units by the end of 2030.
In value terms, the market is forecast to increase with an anticipated CAGR of +3.7% for the period from 2023 to 2030, which is projected to bring the market value to $14.1B (in nominal prices) by the end of 2030.
Consumption
World Consumption of Thermostats
In 2023, global thermostat consumption amounted to 1.6B units, approximately mirroring the previous year's figure. Overall, consumption saw a relatively flat trend pattern. As a result, consumption reached the peak volume of 1.8B units. From 2022 to 2023, the growth of the global consumption remained at a somewhat lower figure.
The global thermostat market value reached $10.9B in 2023, picking up by 4.2% against the previous year. This figure reflects the total revenues of producers and importers (excluding logistics costs, retail marketing costs, and retailers' margins, which will be included in the final consumer price). Over the period under review, consumption saw a relatively flat trend pattern. Global consumption peaked in 2023 and is likely to continue growth in the near future.
Consumption By Country
The countries with the highest volumes of consumption in 2023 were India (405M units), China (329M units) and the United States (89M units), with a combined 51% share of global consumption.
From 2013 to 2023, the most notable rate of growth in terms of consumption, amongst the key consuming countries, was attained by India (with a CAGR of +10.1%), while consumption for the other global leaders experienced more modest paces of growth.
In value terms, the largest thermostat markets worldwide were India ($1.4B), Japan ($1.3B) and the United States ($843M), with a combined 32% share of the global market.
India, with a CAGR of +9.8%, saw the highest rates of growth with regard to market size in terms of the main consuming countries over the period under review, while market for the other global leaders experienced more modest paces of growth.
The countries with the highest levels of thermostat per capita consumption in 2023 were Germany (1,066 units per 1000 persons), Italy (631 units per 1000 persons) and Turkey (596 units per 1000 persons).
From 2013 to 2023, the most notable rate of growth in terms of consumption, amongst the main consuming countries, was attained by India (with a CAGR of +8.9%), while consumption for the other global leaders experienced more modest paces of growth.
Production
World Production of Thermostats
Global thermostat production expanded slightly to 1.5B units in 2023, growing by 1.9% on 2022 figures. Over the period under review, production, however, recorded a relatively flat trend pattern. The pace of growth was the most pronounced in 2021 with an increase of 11%. Over the period under review, global production attained the maximum volume at 1.6B units in 2017; however, from 2018 to 2023, production stood at a somewhat lower figure.
In value terms, thermostat production expanded slightly to $9.4B in 2023 estimated in export price. In general, production saw a relatively flat trend pattern. The most prominent rate of growth was recorded in 2021 when the production volume increased by 12%. Global production peaked at $9.9B in 2018; however, from 2019 to 2023, production failed to regain momentum.
Production By Country
The countries with the highest volumes of production in 2023 were China (610M units), India (375M units) and Germany (71M units), with a combined 69% share of global production. Mexico, France, Japan, Croatia, Italy and the Czech Republic lagged somewhat behind, together accounting for a further 15%.
From 2013 to 2023, the most notable rate of growth in terms of production, amongst the key producing countries, was attained by Croatia (with a CAGR of +10.6%), while production for the other global leaders experienced more modest paces of growth.
Imports
World Imports of Thermostats
In 2023, purchases abroad of thermostats decreased by -9.6% to 962M units, falling for the second year in a row after two years of growth. In general, imports continue to indicate a mild slump. The pace of growth was the most pronounced in 2021 when imports increased by 31% against the previous year. As a result, imports reached the peak of 1.4B units. From 2022 to 2023, the growth of global imports failed to regain momentum.
In value terms, thermostat imports dropped slightly to $5B in 2023. The total import value increased at an average annual rate of +3.0% from 2013 to 2023; however, the trend pattern indicated some noticeable fluctuations being recorded in certain years. The most prominent rate of growth was recorded in 2021 with an increase of 22% against the previous year. As a result, imports attained the peak of $5.2B. From 2022 to 2023, the growth of global imports remained at a somewhat lower figure.
Imports By Country
In 2023, the United States (115M units) and Hong Kong SAR (113M units) represented the main importers of thermostatsin the world, together making up 24% of total imports. Germany (75M units) took the next position in the ranking, followed by Mexico (70M units), Turkey (59M units) and China (52M units). All these countries together took near 27% share of total imports. South Korea (40M units), Italy (38M units), India (36M units), Indonesia (30M units), France (28M units), Poland (23M units) and Tunisia (21M units) followed a long way behind the leaders.
From 2013 to 2023, the most notable rate of growth in terms of purchases, amongst the leading importing countries, was attained by South Korea (with a CAGR of +13.7%), while imports for the other global leaders experienced more modest paces of growth.
In value terms, the United States ($1.1B) constitutes the largest market for imported thermostats worldwide, comprising 23% of global imports. The second position in the ranking was held by Germany ($490M), with a 9.8% share of global imports. It was followed by China, with a 6.2% share.
From 2013 to 2023, the average annual growth rate of value in the United States totaled +2.6%. The remaining importing countries recorded the following average annual rates of imports growth: Germany (+3.3% per year) and China (+6.3% per year).
Import Prices By Country
In 2023, the average thermostat import price amounted to $5.2 per unit, growing by 7.9% against the previous year. Over the period under review, import price indicated measured growth from 2013 to 2023: its price increased at an average annual rate of +4.6% over the last decade. The trend pattern, however, indicated some noticeable fluctuations being recorded throughout the analyzed period. Based on 2023 figures, thermostat import price increased by +42.3% against 2021 indices. The growth pace was the most rapid in 2022 when the average import price increased by 32% against the previous year. Over the period under review, average import prices attained the maximum in 2023 and is expected to retain growth in the near future.
Prices varied noticeably by country of destination: amid the top importers, the country with the highest price was the United States ($9.9 per unit), while Indonesia ($0.7 per unit) was amongst the lowest.
From 2013 to 2023, the most notable rate of growth in terms of prices was attained by Italy (+8.4%), while the other global leaders experienced more modest paces of growth.
Exports
World Exports of Thermostats
In 2023, the amount of thermostats exported worldwide reduced to 890M units, waning by -9.2% on 2022. In general, exports showed a pronounced shrinkage. The most prominent rate of growth was recorded in 2021 when exports increased by 15% against the previous year. As a result, the exports reached the peak of 1.2B units. From 2022 to 2023, the growth of the global exports remained at a somewhat lower figure.
In value terms, thermostat exports stood at $4.9B in 2023. The total export value increased at an average annual rate of +3.0% over the period from 2013 to 2023; the trend pattern indicated some noticeable fluctuations being recorded in certain years. The pace of growth was the most pronounced in 2021 with an increase of 25% against the previous year. As a result, the exports reached the peak of $4.9B; afterwards, it flattened through to 2023.
Exports By Country
In 2023, China (333M units) was the main exporter of thermostats, creating 37% of total exports. Hong Kong SAR (105M units) held a 12% share (based on physical terms) of total exports, which put it in second place, followed by Mexico (9.4%), Germany (6.5%) and France (5%). The following exporters - the United States (35M units), Italy (34M units), the Czech Republic (25M units), Croatia (24M units) and Tunisia (18M units) - together made up 15% of total exports.
From 2013 to 2023, average annual rates of growth with regard to thermostat exports from China stood at +1.2%. At the same time, Croatia (+8.0%) and Tunisia (+7.1%) displayed positive paces of growth. Moreover, Croatia emerged as the fastest-growing exporter exported in the world, with a CAGR of +8.0% from 2013-2023. Mexico and France experienced a relatively flat trend pattern. By contrast, the United States (-1.0%), Italy (-4.0%), Hong Kong SAR (-5.2%), the Czech Republic (-5.4%) and Germany (-6.2%) illustrated a downward trend over the same period. China (+11 p.p.), Mexico (+2.1 p.p.) and Croatia (+1.7 p.p.) significantly strengthened its position in terms of the global exports, while Germany and Hong Kong SAR saw its share reduced by -3.4% and -4.4% from 2013 to 2023, respectively. The shares of the other countries remained relatively stable throughout the analyzed period.
In value terms, China ($790M), Germany ($659M) and Mexico ($574M) appeared to be the countries with the highest levels of exports in 2023, together comprising 41% of global exports. The United States, France, Italy, Hong Kong SAR, the Czech Republic, Tunisia and Croatia lagged somewhat behind, together comprising a further 27%.
Tunisia, with a CAGR of +9.1%, saw the highest rates of growth with regard to the value of exports, in terms of the main exporting countries over the period under review, while shipments for the other global leaders experienced more modest paces of growth.
Export Prices By Country
The average thermostat export price stood at $5.5 per unit in 2023, rising by 11% against the previous year. In general, export price indicated a buoyant expansion from 2013 to 2023: its price increased at an average annual rate of +5.3% over the last decade. The trend pattern, however, indicated some noticeable fluctuations being recorded throughout the analyzed period. Based on 2023 figures, thermostat export price increased by +42.4% against 2020 indices. The most prominent rate of growth was recorded in 2022 when the average export price increased by 17%. Over the period under review, the average export prices attained the peak figure in 2023 and is expected to retain growth in the immediate term.
Prices varied noticeably by country of origin: amid the top suppliers, the country with the highest price was Germany ($11 per unit), while Hong Kong SAR ($1.6 per unit) was amongst the lowest.
From 2013 to 2023, the most notable rate of growth in terms of prices was attained by the Czech Republic (+10.8%), while the other global leaders experienced more modest paces of growth.
This report provides an in-depth analysis of the global thermostat market. Within it, you will discover the latest data on market trends and opportunities by country, consumption, production and price developments, as well as the global trade (imports and exports). The forecast exhibits the market prospects through 2030.
Product coverage:
- Prodcom 26517015 - Electronic thermostats
- Prodcom 26517019 - Non-electronic thermostats
Country coverage:
Worldwide - the report contains statistical data for 200 countries and includes detailed profiles of the 50 largest consuming countries:
- USA
- China
- Japan
- Germany
- United Kingdom
- France
- Brazil
- Italy
- Russian Federation
- India
- Canada
- Australia
- Republic of Korea
- Spain
- Mexico
- Indonesia
- Netherlands
- Turkey
- Saudi Arabia
- Switzerland
- Sweden
- Nigeria
- Poland
- Belgium
- Argentina
- Norway
- Austria
- Thailand
- United Arab Emirates
- Colombia
- Denmark
- South Africa
- Malaysia
- Israel
- Singapore
- Egypt
- Philippines
- Finland
- Chile
- Ireland
- Pakistan
- Greece
- Portugal
- Kazakhstan
- Algeria
- Czech Republic
- Qatar
- Peru
- Romania
- Vietnam
+ the largest producing countries
Data coverage:
- Global market volume and value
- Per Capita consumption
- Forecast of the market dynamics in the medium term
- Global production, split by region and country
- Global trade (exports and imports)
- Export and import prices
- Market trends, drivers and restraints
- Key market players and their profiles
Reasons to buy this report:
- Take advantage of the latest data
- Find deeper insights into current market developments
- Discover vital success factors affecting the market
This report is designed for manufacturers, distributors, importers, and wholesalers, as well as for investors, consultants and advisors.
In this report, you can find information that helps you to make informed decisions on the following issues:
- How to diversify your business and benefit from new market opportunities
- How to load your idle production capacity
- How to boost your sales on overseas markets
- How to increase your profit margins
- How to make your supply chain more sustainable
- How to reduce your production and supply chain costs
- How to outsource production to other countries
- How to prepare your business for global expansion
While doing this research, we combine the accumulated expertise of our analysts and the capabilities of artificial intelligence. The AI-based platform, developed by our data scientists, constitutes the key working tool for business analysts, empowering them to discover deep insights and ideas from the marketing data.
-
1. INTRODUCTION
Making Data-Driven Decisions to Grow Your Business
- REPORT DESCRIPTION
- RESEARCH METHODOLOGY AND AI PLATFORM
- DATA-DRIVEN DECISIONS FOR YOUR BUSINESS
- GLOSSARY AND SPECIFIC TERMS
-
2. EXECUTIVE SUMMARY
A Quick Overview of Market Performance
- KEY FINDINGS
- MARKET TRENDS This Chapter is Available Only for the Professional Edition PRO
-
3. MARKET OVERVIEW
Understanding the Current State of The Market and Its Prospects
- MARKET SIZE
- CONSUMPTION BY COUNTRY
- MARKET FORECAST TO 2030
-
4. MOST PROMISING PRODUCT
Finding New Products to Diversify Your Business
This Chapter is Available Only for the Professional Edition PRO- TOP PRODUCTS TO DIVERSIFY YOUR BUSINESS
- BEST-SELLING PRODUCTS
- MOST CONSUMED PRODUCT
- MOST TRADED PRODUCT
- MOST PROFITABLE PRODUCT FOR EXPORT
-
5. MOST PROMISING SUPPLYING COUNTRIES
Choosing the Best Countries to Establish Your Sustainable Supply Chain
This Chapter is Available Only for the Professional Edition PRO- TOP COUNTRIES TO SOURCE YOUR PRODUCT
- TOP PRODUCING COUNTRIES
- TOP EXPORTING COUNTRIES
- LOW-COST EXPORTING COUNTRIES
-
6. MOST PROMISING OVERSEAS MARKETS
Choosing the Best Countries to Boost Your Exports
This Chapter is Available Only for the Professional Edition PRO- TOP OVERSEAS MARKETS FOR EXPORTING YOUR PRODUCT
- TOP CONSUMING MARKETS
- UNSATURATED MARKETS
- TOP IMPORTING MARKETS
- MOST PROFITABLE MARKETS
7. GLOBAL PRODUCTION
The Latest Trends and Insights into The Industry
- PRODUCTION VOLUME AND VALUE
- PRODUCTION BY COUNTRY
8. GLOBAL IMPORTS
The Largest Importers on The Market and How They Succeed
- IMPORTS FROM 2012–2023
- IMPORTS BY COUNTRY
- IMPORT PRICES BY COUNTRY
9. GLOBAL EXPORTS
The Largest Exporters on The Market and How They Succeed
- EXPORTS FROM 2012–2023
- EXPORTS BY COUNTRY
- EXPORT PRICES BY COUNTRY
-
10. PROFILES OF MAJOR PRODUCERS
The Largest Producers on The Market and Their Profiles
This Chapter is Available Only for the Professional Edition PRO -
11. COUNTRY PROFILES
The Largest Markets And Their Profiles
This Chapter is Available Only for the Professional Edition PRO- United States
- China
- Japan
- Germany
- United Kingdom
- France
- Brazil
- Italy
- Russian Federation
- India
- Canada
- Australia
- Republic of Korea
- Spain
- Mexico
- Indonesia
- Netherlands
- Turkey
- Saudi Arabia
- Switzerland
- Sweden
- Nigeria
- Poland
- Belgium
- Argentina
- Norway
- Austria
- Thailand
- United Arab Emirates
- Colombia
- Denmark
- South Africa
- Malaysia
- Israel
- Singapore
- Egypt
- Philippines
- Finland
- Chile
- Ireland
- Pakistan
- Greece
- Portugal
- Kazakhstan
- Algeria
- Czech Republic
- Qatar
- Peru
- Romania
- Vietnam
-
LIST OF TABLES
- Key Findings In 2023
- Market Volume, In Physical Terms, 2012–2023
- Market Value, 2012–2023
- Per Capita Consumption, By Country, 2018–2023
- Production, In Physical Terms, By Country, 2012–2023
- Imports, In Physical Terms, By Country, 2012–2023
- Imports, In Value Terms, By Country, 2012–2023
- Import Prices, By Country Of Destination, 2012–2023
- Exports, In Physical Terms, By Country, 2012–2023
- Exports, In Value Terms, By Country, 2012–2023
- Export Prices, By Country Of Origin, 2012–2023
-
LIST OF FIGURES
- Market Volume, In Physical Terms, 2012–2023
- Market Value, 2012–2023
- Consumption, By Country, 2023
- Market Volume Forecast to 2030
- Market Value Forecast to 2030
- Products: Market Size And Growth, By Type
- Products: Average Per Capita Consumption, By Type
- Products: Exports And Growth, By Type
- Products: Export Prices And Growth, By Type
- Production Volume And Growth
- Exports And Growth
- Export Prices And Growth
- Market Size And Growth
- Per Capita Consumption
- Imports And Growth
- Import Prices
- Production, In Physical Terms, 2012–2023
- Production, In Value Terms, 2012–2023
- Production, By Country, 2023
- Production, In Physical Terms, By Country, 2012–2023
- Imports, In Physical Terms, 2012–2023
- Imports, In Value Terms, 2012–2023
- Imports, In Physical Terms, By Country, 2023
- Imports, In Physical Terms, By Country, 2012–2023
- Imports, In Value Terms, By Country, 2012–2023
- Import Prices, By Country, 2012–2023
- Exports, In Physical Terms, 2012–2023
- Exports, In Value Terms, 2012–2023
- Exports, In Physical Terms, By Country, 2023
- Exports, In Physical Terms, By Country, 2012–2023
- Exports, In Value Terms, By Country, 2012–2023
- Export Prices, 2012–2023


