
Spain - Steel Springs And Leaves For Springs - Market Analysis, Forecast, Size, Trends and Insights
Get instant access to more than 2 million reports, dashboards, and datasets on the IndexBox Platform.
View PricingThe Average Price of Steel Springs in Spain Is $3,791 per Ton
Spain Steel Spring Export Price in June 2023
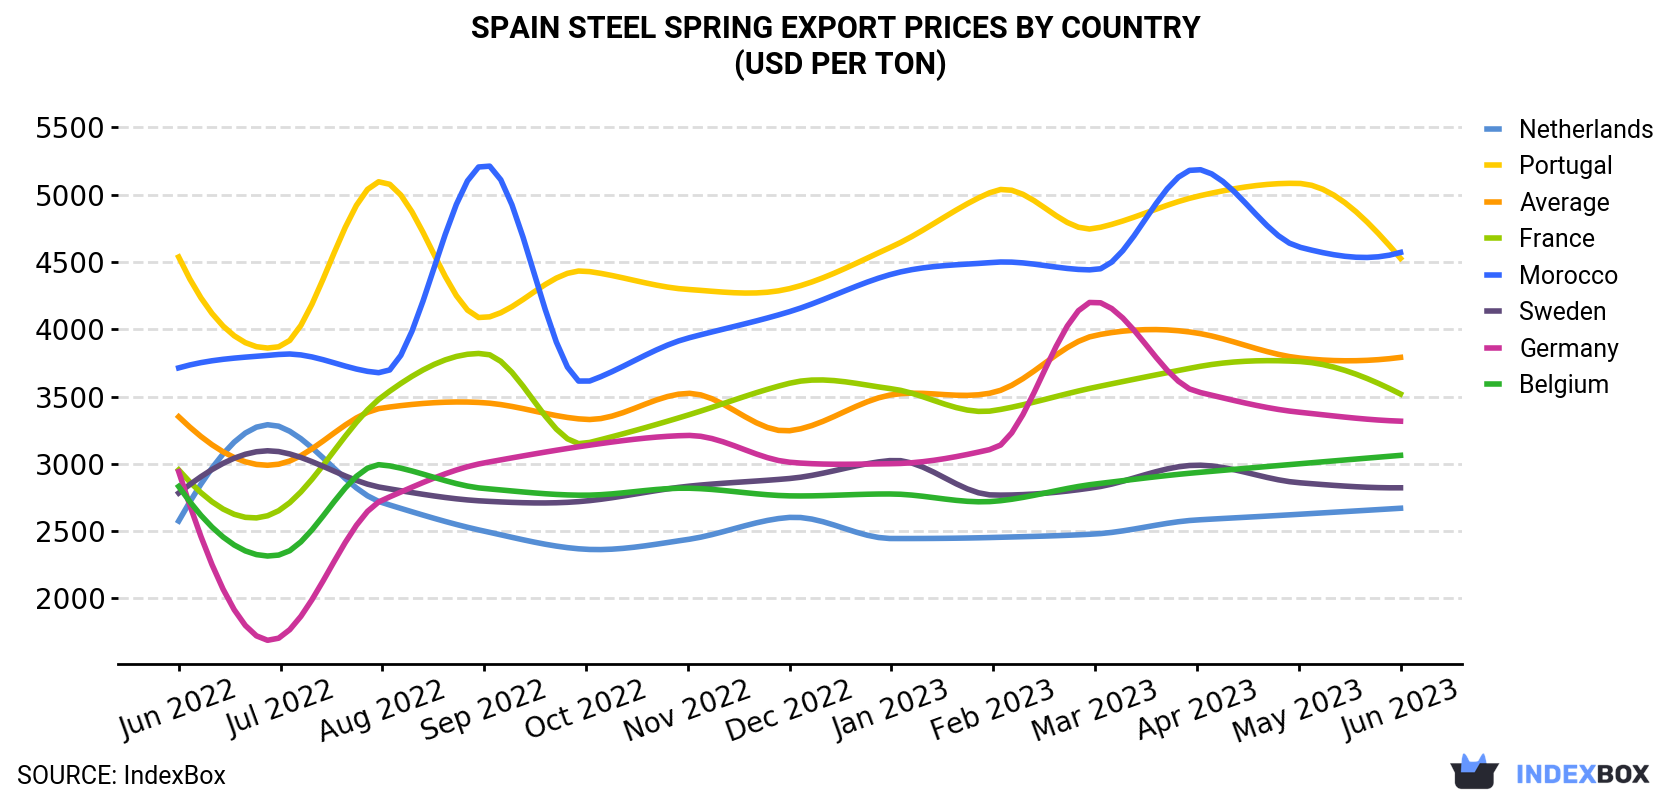
In June 2023, the steel spring price amounted to $3,791 per ton (FOB, Spain), approximately reflecting the previous month. Over the period from June 2022 to June 2023, it increased at an average monthly rate of +1.0%. The most prominent rate of growth was recorded in August 2022 when the average export price increased by 14% against the previous month. Over the period under review, the average export prices reached the maximum at $3,972 per ton in April 2023; however, from May 2023 to June 2023, the export prices stood at a somewhat lower figure.
Prices varied noticeably by the country of destination: the country with the highest price was Morocco ($4,571 per ton), while the average price for exports to the Netherlands ($2,670 per ton) was amongst the lowest.
From June 2022 to June 2023, the most notable rate of growth in terms of prices was recorded for supplies to Morocco (+1.7%), while the prices for the other major destinations experienced more modest paces of growth.
| COUNTRY | Export Price of Steel Spring in Spain (USD per ton) | ||||||||||||
|---|---|---|---|---|---|---|---|---|---|---|---|---|---|
| Jun 2022 | Jul 2022 | Aug 2022 | Sep 2022 | Oct 2022 | Nov 2022 | Dec 2022 | Jan 2023 | Feb 2023 | Mar 2023 | Apr 2023 | May 2023 | Jun 2023 | |
| Morocco | 3,713 | 3,814 | 3,676 | 5,223 | 3,606 | 3,934 | 4,131 | 4,409 | 4,497 | 4,442 | 5,189 | 4,612 | 4,571 |
| Portugal | 4,537 | 3,873 | 5,098 | 4,084 | 4,432 | 4,296 | 4,302 | 4,612 | 5,025 | 4,749 | 4,987 | 5,084 | 4,527 |
| France | 2,955 | 2,660 | 3,500 | 3,819 | 3,152 | 3,362 | 3,599 | 3,558 | 3,395 | 3,569 | 3,720 | 3,761 | 3,519 |
| Germany | 2,942 | 1,712 | 2,731 | 3,007 | 3,135 | 3,211 | 3,012 | 3,001 | 3,112 | 4,205 | 3,536 | 3,384 | 3,317 |
| Belgium | 2,832 | 2,325 | 2,993 | 2,817 | 2,767 | 2,819 | 2,762 | 2,776 | 2,721 | 2,850 | 2,935 | 3,000 | 3,063 |
| Sweden | 2,783 | 3,089 | 2,823 | 2,723 | 2,724 | 2,833 | 2,891 | 3,025 | 2,768 | 2,825 | 2,990 | 2,860 | 2,822 |
| Netherlands | 2,575 | 3,275 | 2,711 | 2,500 | 2,365 | 2,438 | 2,602 | 2,445 | 2,453 | 2,479 | 2,583 | 2,625 | 2,670 |
| Average | 3,350 | 3,000 | 3,415 | 3,454 | 3,330 | 3,524 | 3,246 | 3,513 | 3,530 | 3,954 | 3,972 | 3,787 | 3,791 |
Spain Steel Spring Export Prices by Type
There were significant differences in the average prices for the major types of exported product. In June 2023, the product with the highest price was iron or steel flat spiral or discs springs ($10,565 per ton), while the average price for exports of iron or steel leaf-springs and leaves ($2,972 per ton) was amongst the lowest.
From June 2022 to June 2023, the most notable rate of growth in terms of prices was recorded for the following types: metal spiral or discs spring (+1.3%), while the prices for the other products experienced more modest paces of growth.
Spain Steel Spring Exports
Steel spring exports from Spain totaled 5.6K tons in June 2023, picking up by 1.8% against the previous month. Over the period under review, exports saw a relatively flat trend pattern. The pace of growth appeared the most rapid in August 2022 with an increase of 46% against the previous month.
In value terms, steel spring exports rose modestly to $21M (IndexBox estimates) in June 2023. In general, total exports indicated a mild expansion from June 2022 to June 2023: its value increased at an average monthly rate of +1.8% over the last twelve months. The trend pattern, however, indicated some noticeable fluctuations being recorded throughout the analyzed period. Based on June 2023 figures, exports increased by +18.3% against April 2023 indices. The growth pace was the most rapid in August 2022 when exports increased by 66% month-to-month.
Spain Steel Spring Exports by Type
Iron or steel leaf-springs and leaves (4.1K tons) was the largest type of steel spring exported from Spain, with a 74% share of total exports. Moreover, iron or steel leaf-springs and leaves exceeded the volume of the second product type, iron or steel hot-worked helical springs (949 tons), fourfold.
From June 2022 to June 2023, the average monthly rate of growth in terms of the volume of export of iron or steel leaf-springs and leaves was relatively modest. With regard to the other exported products, the following average monthly rates of growth were recorded: iron or steel hot-worked helical springs (+1.3% per month) and iron or steel flat spiral or discs springs (+1.7% per month).
In value terms, iron or steel leaf-springs and leaves ($12M) remains the largest type of steel spring exported from Spain, comprising 58% of total exports. The second position in the ranking was taken by iron or steel flat spiral or discs springs ($5.1M), with a 24% share of total exports.
From June 2022 to June 2023, the average monthly growth rate of the export volume of iron or steel leaf-springs and leaves totaled +1.3%. With regard to the other exported products, the following average monthly rates of growth were recorded: iron or steel flat spiral or discs springs (+3.0% per month) and iron or steel hot-worked helical springs (+2.2% per month).
Spain Steel Spring Exports by Country
Germany (1.5K tons), the Netherlands (947 tons) and France (775 tons) were the main destinations of steel spring exports from Spain, with a combined 58% share of total exports. These countries were followed by Poland, Sweden, Portugal, Belgium and Morocco, which together accounted for a further 29%.
From June 2022 to June 2023, the biggest increases were in Portugal (with a CAGR of +3.7%), while shipments for the other leaders experienced more modest paces of growth.
In value terms, the largest markets for steel spring exported from Spain were Germany ($4.9M), France ($2.7M) and the Netherlands ($2.5M), with a combined 48% share of total exports. Poland, Portugal, Morocco, Sweden and Belgium lagged somewhat behind, together comprising a further 29%.
Portugal, with a CAGR of +3.6%, saw the highest rates of growth with regard to the value of exports, among the main countries of destination over the period under review, while shipments for the other leaders experienced more modest paces of growth.
This report provides an in-depth analysis of the steel spring market in Spain. Within it, you will discover the latest data on market trends and opportunities by country, consumption, production and price developments, as well as the global trade (imports and exports). The forecast exhibits the market prospects through 2030.
Product coverage:
- Prodcom 25931613 - Iron or steel hot-worked laminated leaf-springs and leaves therefor
- Prodcom 25931615 - Iron or steel hot-worked non-laminated leaf-springs and leaves therefor
- Prodcom 25931617 - Iron or steel cold-formed leaf-springs and leaves therefor
- Prodcom 25931631 - Iron or steel hot-worked helical springs
- Prodcom 25931633 - Iron or steel cold-formed helical coil compression springs
- Prodcom 25931635 - Iron or steel cold-formed helical coil tension springs
- Prodcom 25931637 - Iron or steel cold-formed helical springs (excluding helical coil compression springs, helical coil tension springs)
- Prodcom 25931653 - Iron or steel flat spiral springs
- Prodcom 25931655 - Iron or steel discs springs
- Prodcom 25931660 - Iron or steel springs (excluding leaf-springs and leaves therefor, helical springs, flat spiral springs, discs springs)
Country coverage:
- Spain
Data coverage:
- Market volume and value
- Per Capita consumption
- Forecast of the market dynamics in the medium term
- Trade (exports and imports) in Spain
- Export and import prices
- Market trends, drivers and restraints
- Key market players and their profiles
Reasons to buy this report:
- Take advantage of the latest data
- Find deeper insights into current market developments
- Discover vital success factors affecting the market
This report is designed for manufacturers, distributors, importers, and wholesalers, as well as for investors, consultants and advisors.
In this report, you can find information that helps you to make informed decisions on the following issues:
- How to diversify your business and benefit from new market opportunities
- How to load your idle production capacity
- How to boost your sales on overseas markets
- How to increase your profit margins
- How to make your supply chain more sustainable
- How to reduce your production and supply chain costs
- How to outsource production to other countries
- How to prepare your business for global expansion
While doing this research, we combine the accumulated expertise of our analysts and the capabilities of artificial intelligence. The AI-based platform, developed by our data scientists, constitutes the key working tool for business analysts, empowering them to discover deep insights and ideas from the marketing data.
-
1. INTRODUCTION
Making Data-Driven Decisions to Grow Your Business
- REPORT DESCRIPTION
- RESEARCH METHODOLOGY AND AI PLATFORM
- DATA-DRIVEN DECISIONS FOR YOUR BUSINESS
- GLOSSARY AND SPECIFIC TERMS
-
2. EXECUTIVE SUMMARY
A Quick Overview of Market Performance
- KEY FINDINGS
- MARKET TRENDS This Chapter is Available Only for the Professional Edition PRO
-
3. MARKET OVERVIEW
Understanding the Current State of The Market and Its Prospects
- MARKET SIZE
- MARKET STRUCTURE
- TRADE BALANCE
- PER CAPITA CONSUMPTION
- MARKET FORECAST TO 2030
-
4. MOST PROMISING PRODUCT
Finding New Products to Diversify Your Business
This Chapter is Available Only for the Professional Edition PRO- TOP PRODUCTS TO DIVERSIFY YOUR BUSINESS
- BEST-SELLING PRODUCTS
- MOST CONSUMED PRODUCT
- MOST TRADED PRODUCT
- MOST PROFITABLE PRODUCT FOR EXPORT
-
5. MOST PROMISING SUPPLYING COUNTRIES
Choosing the Best Countries to Establish Your Sustainable Supply Chain
This Chapter is Available Only for the Professional Edition PRO- TOP COUNTRIES TO SOURCE YOUR PRODUCT
- TOP PRODUCING COUNTRIES
- TOP EXPORTING COUNTRIES
- LOW-COST EXPORTING COUNTRIES
-
6. MOST PROMISING OVERSEAS MARKETS
Choosing the Best Countries to Boost Your Exports
This Chapter is Available Only for the Professional Edition PRO- TOP OVERSEAS MARKETS FOR EXPORTING YOUR PRODUCT
- TOP CONSUMING MARKETS
- UNSATURATED MARKETS
- TOP IMPORTING MARKETS
- MOST PROFITABLE MARKETS
7. PRODUCTION
The Latest Trends and Insights into The Industry
- PRODUCTION VOLUME AND VALUE
8. IMPORTS
The Largest Import Supplying Countries
- IMPORTS FROM 2012–2023
- IMPORTS BY COUNTRY
- IMPORT PRICES BY COUNTRY
9. EXPORTS
The Largest Destinations for Exports
- EXPORTS FROM 2012–2023
- EXPORTS BY COUNTRY
- EXPORT PRICES BY COUNTRY
-
10. PROFILES OF MAJOR PRODUCERS
The Largest Producers on The Market and Their Profiles
This Chapter is Available Only for the Professional Edition PRO -
LIST OF TABLES
- Key Findings In 2023
- Market Volume, In Physical Terms, 2012–2023
- Market Value, 2012–2023
- Per Capita Consumption In 2012-2023
- Imports, In Physical Terms, By Country, 2012–2023
- Imports, In Value Terms, By Country, 2012–2023
- Import Prices, By Country Of Origin, 2012–2023
- Exports, In Physical Terms, By Country, 2012–2023
- Exports, In Value Terms, By Country, 2012–2023
- Export Prices, By Country Of Destination, 2012–2023
-
LIST OF FIGURES
- Market Volume, In Physical Terms, 2012–2023
- Market Value, 2012–2023
- Market Structure – Domestic Supply vs. Imports, In Physical Terms, 2012-2023
- Market Structure – Domestic Supply vs. Imports, In Value Terms, 2012-2023
- Trade Balance, In Physical Terms, 2012-2023
- Trade Balance, In Value Terms, 2012-2023
- Per Capita Consumption, 2012-2023
- Market Volume Forecast to 2030
- Market Value Forecast to 2030
- Products: Market Size And Growth, By Type
- Products: Average Per Capita Consumption, By Type
- Products: Exports And Growth, By Type
- Products: Export Prices And Growth, By Type
- Production Volume And Growth
- Exports And Growth
- Export Prices And Growth
- Market Size And Growth
- Per Capita Consumption
- Imports And Growth
- Import Prices
- Production, In Physical Terms, 2012–2023
- Production, In Value Terms, 2012–2023
- Imports, In Physical Terms, 2012–2023
- Imports, In Value Terms, 2012–2023
- Imports, In Physical Terms, By Country, 2023
- Imports, In Physical Terms, By Country, 2012–2023
- Imports, In Value Terms, By Country, 2012–2023
- Import Prices, By Country Of Origin, 2012–2023
- Exports, In Physical Terms, 2012–2023
- Exports, In Value Terms, 2012–2023
- Exports, In Physical Terms, By Country, 2023
- Exports, In Physical Terms, By Country, 2012–2023
- Exports, In Value Terms, By Country, 2012–2023
- Export Prices, By Country Of Destination, 2012–2023


