Qatar - Lamb And Sheep Meat - Market Analysis, Forecast, Size, Trends and Insights
Get instant access to more than 2 million reports, dashboards, and datasets on the IndexBox Platform.
View PricingImport of Lamb and Sheep Meat in Qatar Drops Dramatically to $124M in 2023
Qatar Lamb and Sheep Meat Imports
In 2023, imports of lamb and sheep meat into Qatar contracted rapidly to 20K tons, dropping by -15.8% against the year before. In general, total imports indicated a resilient increase from 2013 to 2023: its volume increased at an average annual rate of +5.3% over the last decade. The trend pattern, however, indicated some noticeable fluctuations being recorded throughout the analyzed period. Based on 2023 figures, imports increased by +3.2% against 2021 indices. The pace of growth appeared the most rapid in 2014 with an increase of 43%. Imports peaked at 31K tons in 2018; however, from 2019 to 2023, imports remained at a lower figure.
In value terms, lamb and sheep meat imports dropped remarkably to $124M (IndexBox estimates) in 2023. Over the period under review, imports, however, enjoyed buoyant growth. The most prominent rate of growth was recorded in 2018 when imports increased by 57%. As a result, imports attained the peak of $221M. From 2019 to 2023, the growth of imports remained at a somewhat lower figure.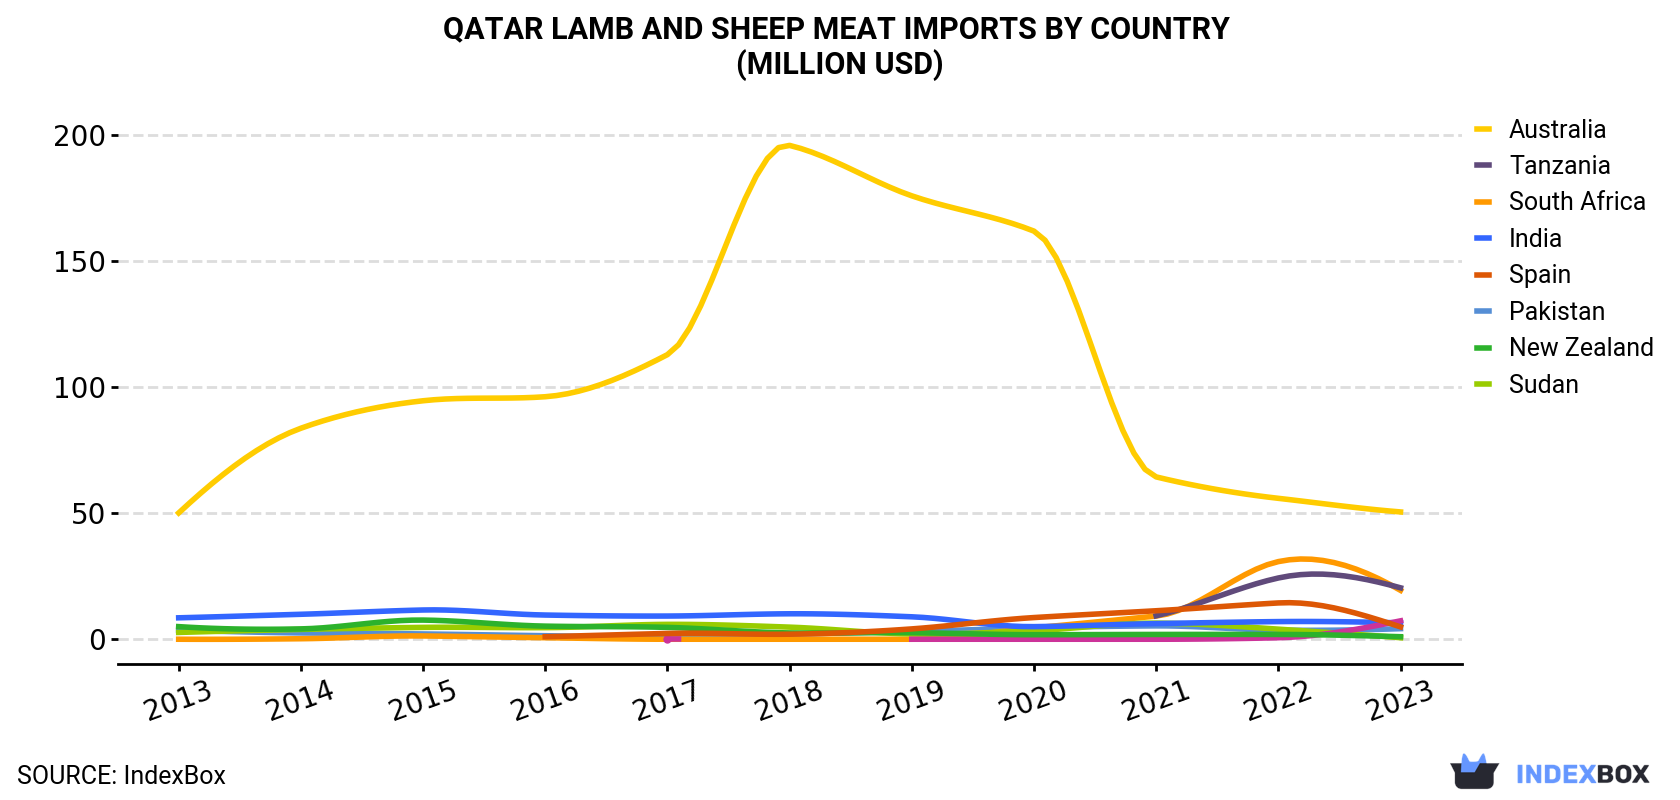
| COUNTRY | Import Value of Lamb and Sheep Meat in Qatar (million USD) | ||||||||||
|---|---|---|---|---|---|---|---|---|---|---|---|
| 2013 | 2014 | 2015 | 2016 | 2017 | 2018 | 2019 | 2020 | 2021 | 2022 | 2023 | |
| Australia | 50.2 | 83.8 | 94.7 | 96.3 | 113 | 196 | 176 | 162 | 64.5 | 56.0 | 50.6 |
| Tanzania | N/A | N/A | N/A | N/A | N/A | N/A | N/A | N/A | 9.4 | 24.4 | 20.5 |
| South Africa | 0.1 | 0.3 | 1.4 | 0.7 | 0.1 | 0.1 | 0.1 | 4.6 | 9.3 | 30.9 | 19.5 |
| Lebanon | N/A | N/A | N/A | N/A | 0.2 | N/A | 0.1 | 0.1 | 0.1 | 0.7 | 7.4 |
| India | 8.6 | 10.0 | 11.7 | 9.7 | 9.3 | 10.2 | 9.0 | 5.1 | 6.3 | 7.1 | 6.6 |
| Spain | N/A | N/A | N/A | 1.1 | 2.4 | 2.1 | 4.2 | 8.7 | 11.4 | 14.5 | 5.0 |
| Pakistan | 3.7 | 2.6 | 2.2 | 1.5 | 1.0 | 2.1 | 3.2 | 4.6 | 5.4 | 3.7 | 4.3 |
| New Zealand | 5.1 | 4.2 | 7.7 | 5.3 | 4.8 | 2.6 | 2.7 | 1.9 | 2.0 | 2.0 | 1.1 |
| Sudan | 2.8 | 4.0 | 4.8 | 4.7 | 6.0 | 4.9 | 2.2 | 3.5 | 6.5 | 4.1 | 0.7 |
| Others | 3.4 | 3.8 | 5.2 | 3.5 | 4.6 | 2.9 | 4.2 | 4.5 | 10.4 | 22.7 | 7.9 |
| Total | 73.9 | 109 | 128 | 123 | 141 | 221 | 202 | 195 | 125 | 166 | 124 |
Imports by Country
In 2023, Australia (7.8K tons) constituted the largest lamb and sheep meat supplier to Qatar, accounting for a 40% share of total imports. Moreover, lamb and sheep meat imports from Australia exceeded the figures recorded by the second-largest supplier, Tanzania (3.5K tons), twofold. The third position in this ranking was held by South Africa (2.7K tons), with a 14% share.
From 2013 to 2023, the average annual rate of growth in terms of volume from Australia stood at +1.2%. The remaining supplying countries recorded the following average annual rates of imports growth: Tanzania (+883.6% per year) and South Africa (+72.0% per year).
In value terms, Australia ($51M) constituted the largest supplier of lamb and sheep meat to Qatar, comprising 41% of total imports. The second position in the ranking was held by Tanzania ($21M), with a 17% share of total imports. It was followed by South Africa, with a 16% share.
From 2013 to 2023, the average annual rate of growth in terms of value from Australia was relatively modest. The remaining supplying countries recorded the following average annual rates of imports growth: Tanzania (+930.1% per year) and South Africa (+71.7% per year).
Imports by Type
Fresh or chilled lamb carcasses and half-carcasses (11K tons), fresh or chilled sheep (excluding lamb) carcasses and half-carcasses (5.5K tons) and frozen sheep (including lamb) cuts with bone in (excluding carcasses and half-carcasses) (2K tons) were the main products of lamb and sheep meat imports to Qatar, together comprising 88% of total imports. Frozen sheep (excluding lamb) carcasses and half-carcasses, fresh or chilled sheep (including lamb) cuts with bone in (excluding carcasses and half-carcasses), frozen lamb carcasses and half-carcasses, frozen sheep (including lamb) boneless cuts and fresh or chilled sheep (including lamb) boneless cuts lagged somewhat behind, together comprising a further 12%.
From 2013 to 2023, the biggest increases were recorded for frozen sheep (excluding lamb) carcasses and half-carcasses (with a CAGR of +16.7%), while purchases for the other products experienced more modest paces of growth.
In value terms, fresh or chilled lamb carcasses and half-carcasses ($70M) constituted the largest type of lamb and sheep meat supplied to Qatar, comprising 57% of total imports. The second position in the ranking was held by fresh or chilled sheep (excluding lamb) carcasses and half-carcasses ($27M), with a 21% share of total imports. It was followed by frozen sheep (including lamb) cuts with bone in (excluding carcasses and half-carcasses), with a 9% share.
Import Prices by Country
In 2023, the lamb and sheep meat price stood at $6,336 per ton (CIF, Qatar), shrinking by -11.4% against the previous year. Over the period under review, the import price recorded a relatively flat trend pattern. The most prominent rate of growth was recorded in 2018 when the average import price increased by 17% against the previous year. Over the period under review, average import prices hit record highs at $7,154 per ton in 2022, and then contracted in the following year.
Prices varied noticeably by country of origin: amid the top importers, the country with the highest price was New Zealand ($10,327 per ton), while the price for Spain ($3,503 per ton) was amongst the lowest.
From 2013 to 2023, the most notable rate of growth in terms of prices was attained by Tanzania (+4.7%), while the prices for the other major suppliers experienced more modest paces of growth.
This report provides an in-depth analysis of the market for lamb and sheep meat in Qatar. Within it, you will discover the latest data on market trends and opportunities by country, consumption, production and price developments, as well as the global trade (imports and exports). The forecast exhibits the market prospects through 2030.
Product coverage:
- FCL 977 - Meat of sheep
Country coverage:
- Qatar
Data coverage:
- Market volume and value
- Per Capita consumption
- Forecast of the market dynamics in the medium term
- Trade (exports and imports) in Qatar
- Export and import prices
- Market trends, drivers and restraints
- Key market players and their profiles
Reasons to buy this report:
- Take advantage of the latest data
- Find deeper insights into current market developments
- Discover vital success factors affecting the market
This report is designed for manufacturers, distributors, importers, and wholesalers, as well as for investors, consultants and advisors.
In this report, you can find information that helps you to make informed decisions on the following issues:
- How to diversify your business and benefit from new market opportunities
- How to load your idle production capacity
- How to boost your sales on overseas markets
- How to increase your profit margins
- How to make your supply chain more sustainable
- How to reduce your production and supply chain costs
- How to outsource production to other countries
- How to prepare your business for global expansion
While doing this research, we combine the accumulated expertise of our analysts and the capabilities of artificial intelligence. The AI-based platform, developed by our data scientists, constitutes the key working tool for business analysts, empowering them to discover deep insights and ideas from the marketing data.
-
1. INTRODUCTION
Making Data-Driven Decisions to Grow Your Business
- REPORT DESCRIPTION
- RESEARCH METHODOLOGY AND AI PLATFORM
- DATA-DRIVEN DECISIONS FOR YOUR BUSINESS
- GLOSSARY AND SPECIFIC TERMS
-
2. EXECUTIVE SUMMARY
A Quick Overview of Market Performance
- KEY FINDINGS
- MARKET TRENDS This Chapter is Available Only for the Professional Edition PRO
-
3. MARKET OVERVIEW
Understanding the Current State of The Market and Its Prospects
- MARKET SIZE
- MARKET STRUCTURE
- TRADE BALANCE
- PER CAPITA CONSUMPTION
- MARKET FORECAST TO 2030
-
4. MOST PROMISING PRODUCT
Finding New Products to Diversify Your Business
This Chapter is Available Only for the Professional Edition PRO- TOP PRODUCTS TO DIVERSIFY YOUR BUSINESS
- BEST-SELLING PRODUCTS
- MOST CONSUMED PRODUCT
- MOST TRADED PRODUCT
- MOST PROFITABLE PRODUCT FOR EXPORT
-
5. MOST PROMISING SUPPLYING COUNTRIES
Choosing the Best Countries to Establish Your Sustainable Supply Chain
This Chapter is Available Only for the Professional Edition PRO- TOP COUNTRIES TO SOURCE YOUR PRODUCT
- TOP PRODUCING COUNTRIES
- COUNTRIES WITH TOP YIELDS
- TOP EXPORTING COUNTRIES
- LOW-COST EXPORTING COUNTRIES
-
6. MOST PROMISING OVERSEAS MARKETS
Choosing the Best Countries to Boost Your Exports
This Chapter is Available Only for the Professional Edition PRO- TOP OVERSEAS MARKETS FOR EXPORTING YOUR PRODUCT
- TOP CONSUMING MARKETS
- UNSATURATED MARKETS
- TOP IMPORTING MARKETS
- MOST PROFITABLE MARKETS
7. PRODUCTION
The Latest Trends and Insights into The Industry
- PRODUCTION, PRODUCING ANIMALS AND YIELD
8. IMPORTS
The Largest Import Supplying Countries
- IMPORTS FROM 2012–2023
- IMPORTS BY COUNTRY
- IMPORT PRICES BY COUNTRY
9. EXPORTS
The Largest Destinations for Exports
- EXPORTS FROM 2012–2023
- EXPORTS BY COUNTRY
- EXPORT PRICES BY COUNTRY
-
10. PROFILES OF MAJOR PRODUCERS
The Largest Producers on The Market and Their Profiles
This Chapter is Available Only for the Professional Edition PRO -
LIST OF TABLES
- Key Findings In 2023
- Market Volume, In Physical Terms, 2012–2023
- Market Value, 2012–2023
- Per Capita Consumption In 2012-2023
- Imports, In Physical Terms, By Country, 2012–2023
- Imports, In Value Terms, By Country, 2012–2023
- Import Prices, By Country Of Origin, 2012–2023
- Exports, In Physical Terms, By Country, 2012–2023
- Exports, In Value Terms, By Country, 2012–2023
- Export Prices, By Country Of Destination, 2012–2023
-
LIST OF FIGURES
- Market Volume, In Physical Terms, 2012–2023
- Market Value, 2012–2023
- Market Structure – Domestic Supply vs. Imports, In Physical Terms, 2012-2023
- Market Structure – Domestic Supply vs. Imports, In Value Terms, 2012-2023
- Trade Balance, In Physical Terms, 2012-2023
- Trade Balance, In Value Terms, 2012-2023
- Per Capita Consumption, 2012-2023
- Market Volume Forecast to 2030
- Market Value Forecast to 2030
- Products: Market Size And Growth, By Type
- Products: Average Per Capita Consumption, By Type
- Products: Exports And Growth, By Type
- Products: Export Prices And Growth, By Type
- Production Volume And Growth
- Yield And Growth
- Exports And Growth
- Export Prices And Growth
- Market Size And Growth
- Per Capita Consumption
- Imports And Growth
- Import Prices
- Production, In Physical Terms, 2012–2023
- Production, In Value Terms, 2012–2023
- Producing Animals Slaughtered, 2012–2023
- Yield, 2012–2023
- Imports, In Physical Terms, 2012–2023
- Imports, In Value Terms, 2012–2023
- Imports, In Physical Terms, By Country, 2023
- Imports, In Physical Terms, By Country, 2012–2023
- Imports, In Value Terms, By Country, 2012–2023
- Import Prices, By Country Of Origin, 2012–2023
- Exports, In Physical Terms, 2012–2023
- Exports, In Value Terms, 2012–2023
- Exports, In Physical Terms, By Country, 2023
- Exports, In Physical Terms, By Country, 2012–2023
- Exports, In Value Terms, By Country, 2012–2023
- Export Prices, By Country Of Destination, 2012–2023


