Qatar - Domestic Appliances - Market Analysis, Forecast, Size, Trends and Insights
Get instant access to more than 2 million reports, dashboards, and datasets on the IndexBox Platform.
View PricingQatar's Import of Domestic Appliances Soars to $14M in October 2023
Qatar Domestic Appliances Imports
In October 2023, supplies from abroad of domestic appliances increased by 58% to 256K units for the first time since June 2023, thus ending a three-month declining trend. Overall, imports, however, saw a pronounced curtailment. Over the period under review, imports reached the peak figure at 459K units in October 2022; however, from November 2022 to October 2023, imports remained at a lower figure.
In value terms, domestic appliances imports soared to $14M (IndexBox estimates) in October 2023. Over the period under review, imports, however, recorded a noticeable shrinkage. Imports peaked at 20M units in October 2022; however, from November 2022 to October 2023, imports failed to regain momentum.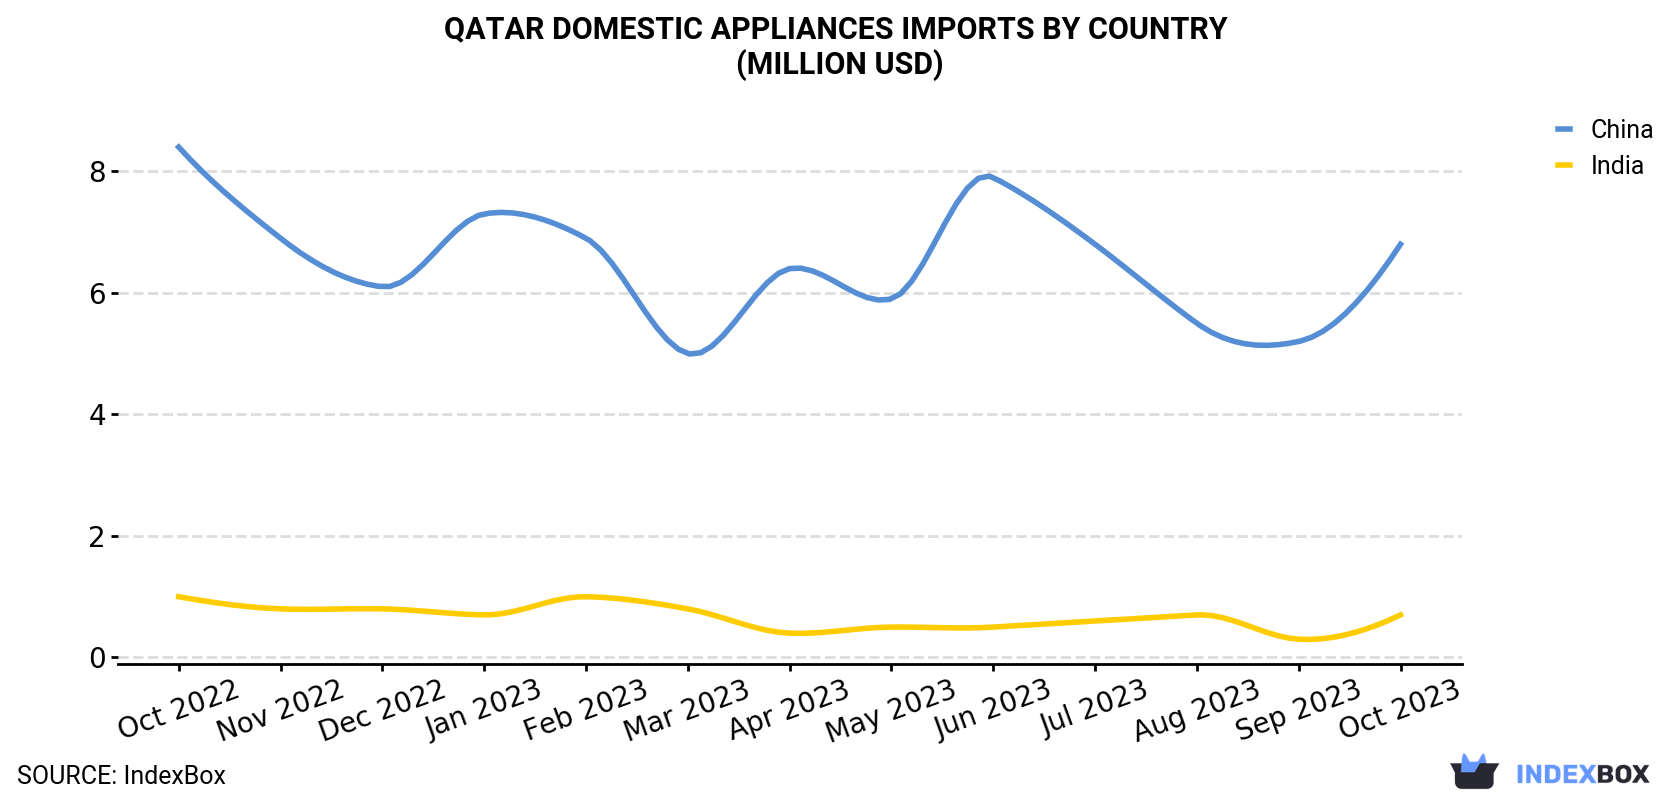
| COUNTRY | Import Value of Domestic Appliances in Qatar (million USD) | ||||||||||||
|---|---|---|---|---|---|---|---|---|---|---|---|---|---|
| Oct 2022 | Nov 2022 | Dec 2022 | Jan 2023 | Feb 2023 | Mar 2023 | Apr 2023 | May 2023 | Jun 2023 | Jul 2023 | Aug 2023 | Sep 2023 | Oct 2023 | |
| China | 8.4 | 6.9 | 6.1 | 7.3 | 6.9 | 5.0 | 6.4 | 5.9 | 7.9 | 6.8 | 5.5 | 5.2 | 6.8 |
| India | 1.0 | 0.8 | 0.8 | 0.7 | 1.0 | 0.8 | 0.4 | 0.5 | 0.5 | 0.6 | 0.7 | 0.3 | 0.7 |
| Others | 11.0 | 8.0 | 7.2 | 6.4 | 4.4 | 5.9 | 4.4 | 7.3 | 4.3 | 5.0 | 5.1 | 4.6 | 6.1 |
| Total | 20.4 | 15.7 | 14.1 | 14.5 | 12.2 | 11.6 | 11.3 | 13.7 | 12.7 | 12.4 | 11.3 | 10.1 | 13.6 |
Imports by Country
In October 2023, China (193K units) constituted the largest supplier of domestic appliances to Qatar, accounting for a 76% share of total imports. Moreover, domestic appliances imports from China exceeded the figures recorded by the second-largest supplier, India (17K units), more than tenfold.
From October 2022 to October 2023, the average monthly rate of growth in terms of volume from China totaled -5.0%.
In value terms, China ($6.8M) constituted the largest supplier of domestic appliances to Qatar, comprising 50% of total imports. The second position in the ranking was held by India ($669K), with a 4.9% share of total imports.
From October 2022 to October 2023, the average monthly rate of growth in terms of value from China totaled -1.8%.
Imports by Type
Domestic food grinders and mixers and fruit or vegetable juice extractors (41K units), electric shavers, hair-removing appliances and hair clippers (39K units) and electric smoothing irons (33K units) were the main products of domestic appliances imports to Qatar, together accounting for 44% of total imports. These products were followed by electric water heaters and immersion heaters, domestic electro-thermic appliances other than heaters, dryers, irons, ovens, toasters and coffee machines, table, floor, wall, window, ceiling or roof fans, hair curlers and curling tongs, electric space heating apparatus and soil heating apparatus, domestic electric coffee or tea makers, vacuum cleaners with motor, electric hair dryers, household washing and drying machines, domestic electric toasters, electric ovens, cookers, cooking plates, boiling rings, grillers and roasters, microwave ovens, household refrigerators and freezers (not combined), domestic, non-electric, cooking or heating appliances, combined refrigerators-freezers, ventilating or eecycling hoods incorporating a fan, vacuum cleaners without motor, household dishwashing machines, iron or steel liquid fuel domestic appliances, non-electric instantaneous or storage water heaters and iron or steel solid fuel domestic appliances, which together accounted for a further 56%.
From October 2022 to October 2023, the biggest increases were in metal liquid fuel appliances (with a CAGR of +6.0%), while purchases for the other products experienced more modest paces of growth.
In value terms, the most traded types of domestic appliances in Qatar were household washing and drying machines ($1.8M), electric water heaters and immersion heaters ($1.6M) and combined refrigerators-freezers ($1.3M), with a combined 34% share of total imports. Electric ovens, cookers, cooking plates, boiling rings, grillers and roasters, household refrigerators and freezers (not combined), domestic food grinders and mixers and fruit or vegetable juice extractors, vacuum cleaners with motor, electric smoothing irons, electric shavers, hair-removing appliances and hair clippers, table, floor, wall, window, ceiling or roof fans, hair curlers and curling tongs, domestic electro-thermic appliances other than heaters, dryers, irons, ovens, toasters and coffee machines, electric space heating apparatus and soil heating apparatus, domestic electric coffee or tea makers, non-electric instantaneous or storage water heaters, microwave ovens, domestic, non-electric, cooking or heating appliances, ventilating or eecycling hoods incorporating a fan, vacuum cleaners without motor, electric hair dryers, household dishwashing machines, domestic electric toasters, iron or steel liquid fuel domestic appliances and iron or steel solid fuel domestic appliances lagged somewhat behind, together comprising a further 66%.
Import Prices by Country
In October 2023, the domestic appliances price stood at $53.1 per unit (CIF, Qatar), shrinking by -15% against the previous month. Over the period from October 2022 to October 2023, it increased at an average monthly rate of +1.5%. The pace of growth was the most pronounced in January 2023 an increase of 16% m-o-m. The import price peaked at $66.1 per unit in March 2023; however, from April 2023 to October 2023, import prices failed to regain momentum.
There were significant differences in the average prices amongst the major supplying countries. In October 2023, the country with the highest price was Indonesia ($155 per unit), while the price for China ($35.1 per unit) was amongst the lowest.
From October 2022 to October 2023, the most notable rate of growth in terms of prices was attained by Indonesia (+8.9%), while the prices for the other major suppliers experienced mixed trend patterns.
This report provides an in-depth analysis of the domestic appliances market in Qatar. Within it, you will discover the latest data on market trends and opportunities by country, consumption, production and price developments, as well as the global trade (imports and exports). The forecast exhibits the market prospects through 2030.
Product coverage:
- Prodcom 27511400 - Electric blankets
- Prodcom 27521113 - Iron or steel gas domestic cooking appliances and plate warmers, with an oven (including those with subsidiary boilers for central heating, separate ovens for both gas and other fuels)
- Prodcom 27521115 - Iron or steel gas domestic cooking appliances and plate warmers (including those with subsidiary boilers for central heating, for both gas and other fuels, excluding those with ovens)
- Prodcom 27521190 - Other domestic cooking appliances and plate warmers, of iron or steel or of copper, non-electric
- Prodcom 27521234 - Iron or steel gas domestic appliances, including heaters, g rates, fires and braziers, for both gas and other fuels radiators (excluding cooking appliances and plate warmers )
- Prodcom 27521250 - Iron or steel liquid fuel domestic appliances, including heaters, grates, fires and braziers (excluding cooking appliances and plate warmers)
- Prodcom 27521270 - Iron or steel solid fuel domestic appliances, including heaters, g rates, fires and braziers (excluding cooking appliances and plate warmers)
- Prodcom 27521300 - Air heaters or hot air distributors n.e.c., of iron or steel, nonelectric
- Prodcom 27511530 - Table, floor, wall, window, ceiling or roof fans, with a selfcontained electric motor of an output . .125 W
- Prodcom 27511580 - Ventilating or recycling hoods incorporating a fan, with a maximum horizontal side . .120 cm
- Prodcom 27511110 - Combined refrigerators-freezers, with separate external doors
- Prodcom 27511133 - Household-type refrigerators (including compression-type, e lectrical absorption-type) (excluding built-in)
- Prodcom 27511135 - Compression-type built-in refrigerators
- Prodcom 27511150 - Chest freezers of a capacity . .800 litres
- Prodcom 27511170 - Upright freezers of a capacity . .900 litres
- Prodcom 27521400 - Non-electric instantaneous or storage water heaters
- Prodcom 27511200 - Household dishwashing machines
- Prodcom 27511300 - Cloth washing and drying machines, of the household type
- Prodcom 27512123 - Vacuum cleaners with a self-contained electric motor of a power . 1 .500 W and having a dust bag or other receptable capacity . .20 l
- Prodcom 27512125 - Other vacuum cleaners with a self-contained electric motor
- Prodcom 27512410 - Vacuum cleaners, including dry cleaners and wet vacuum cleaners (excluding with self-contained electric motor)
- Prodcom 27512170 - Domestic food grinders, mixers and fruit or vegetable juice extractors, with a self-contained electric motor
- Prodcom 27512200 - Shavers, hair-removing appliances and hair clippers, with selfcontained electric motor
- Prodcom 27512530 - Electric instantaneous water heaters
- Prodcom 27512560 - Electric water heaters and immersion heaters (excluding instantaneous water heaters)
- Prodcom 27512630 - Electric storage heating radiators
- Prodcom 27512650 - Electric radiators, convection heaters and heaters or fires with built-in fans
- Prodcom 27512690 - Other electric space heaters
- Prodcom 27512310 - Electric hair dryers
- Prodcom 27512330 - Electric hairdressing apparatus (including hair curlers, curling tongs) (excluding hair drying hoods, hair dryers)
- Prodcom 27512350 - Electric hand-drying apparatus
- Prodcom 27512370 - Electric smoothing irons
- Prodcom 27512700 - Domestic microwave ovens
- Prodcom 27512810 - Domestic electric cookers with at least an oven and a hob (including combined gas-electric appliances)
- Prodcom 27512830 - Electric cooking plates, boiling rings and hobs for domestic use
- Prodcom 27512850 - Domestic electric grills and roasters
- Prodcom 27512870 - Domestic electric ovens for building-in
- Prodcom 27512890 - Domestic electric ovens (excluding those for building-in, m icrowave ovens)
- Prodcom 27512430 - Domestic electric coffee or tea makers (including percolators)
- Prodcom 27512450 - Domestic electric toasters (including toaster ovens for toasting bread, potatoes or other small items)
- Prodcom 27512900 - Electric heating resistors (excluding of carbon)
Country coverage:
- Qatar
Data coverage:
- Market volume and value
- Per Capita consumption
- Forecast of the market dynamics in the medium term
- Trade (exports and imports) in Qatar
- Export and import prices
- Market trends, drivers and restraints
- Key market players and their profiles
Reasons to buy this report:
- Take advantage of the latest data
- Find deeper insights into current market developments
- Discover vital success factors affecting the market
This report is designed for manufacturers, distributors, importers, and wholesalers, as well as for investors, consultants and advisors.
In this report, you can find information that helps you to make informed decisions on the following issues:
- How to diversify your business and benefit from new market opportunities
- How to load your idle production capacity
- How to boost your sales on overseas markets
- How to increase your profit margins
- How to make your supply chain more sustainable
- How to reduce your production and supply chain costs
- How to outsource production to other countries
- How to prepare your business for global expansion
While doing this research, we combine the accumulated expertise of our analysts and the capabilities of artificial intelligence. The AI-based platform, developed by our data scientists, constitutes the key working tool for business analysts, empowering them to discover deep insights and ideas from the marketing data.
-
1. INTRODUCTION
Making Data-Driven Decisions to Grow Your Business
- REPORT DESCRIPTION
- RESEARCH METHODOLOGY AND AI PLATFORM
- DATA-DRIVEN DECISIONS FOR YOUR BUSINESS
- GLOSSARY AND SPECIFIC TERMS
-
2. EXECUTIVE SUMMARY
A Quick Overview of Market Performance
- KEY FINDINGS
- MARKET TRENDS This Chapter is Available Only for the Professional Edition PRO
-
3. MARKET OVERVIEW
Understanding the Current State of The Market and Its Prospects
- MARKET SIZE
- MARKET STRUCTURE
- TRADE BALANCE
- PER CAPITA CONSUMPTION
- MARKET FORECAST TO 2030
-
4. MOST PROMISING PRODUCT
Finding New Products to Diversify Your Business
This Chapter is Available Only for the Professional Edition PRO- TOP PRODUCTS TO DIVERSIFY YOUR BUSINESS
- BEST-SELLING PRODUCTS
- MOST CONSUMED PRODUCT
- MOST TRADED PRODUCT
- MOST PROFITABLE PRODUCT FOR EXPORT
-
5. MOST PROMISING SUPPLYING COUNTRIES
Choosing the Best Countries to Establish Your Sustainable Supply Chain
This Chapter is Available Only for the Professional Edition PRO- TOP COUNTRIES TO SOURCE YOUR PRODUCT
- TOP PRODUCING COUNTRIES
- TOP EXPORTING COUNTRIES
- LOW-COST EXPORTING COUNTRIES
-
6. MOST PROMISING OVERSEAS MARKETS
Choosing the Best Countries to Boost Your Exports
This Chapter is Available Only for the Professional Edition PRO- TOP OVERSEAS MARKETS FOR EXPORTING YOUR PRODUCT
- TOP CONSUMING MARKETS
- UNSATURATED MARKETS
- TOP IMPORTING MARKETS
- MOST PROFITABLE MARKETS
7. PRODUCTION
The Latest Trends and Insights into The Industry
- PRODUCTION VOLUME AND VALUE
8. IMPORTS
The Largest Import Supplying Countries
- IMPORTS FROM 2012–2023
- IMPORTS BY COUNTRY
- IMPORT PRICES BY COUNTRY
9. EXPORTS
The Largest Destinations for Exports
- EXPORTS FROM 2012–2023
- EXPORTS BY COUNTRY
- EXPORT PRICES BY COUNTRY
-
10. PROFILES OF MAJOR PRODUCERS
The Largest Producers on The Market and Their Profiles
This Chapter is Available Only for the Professional Edition PRO -
LIST OF TABLES
- Key Findings In 2023
- Market Volume, In Physical Terms, 2012–2023
- Market Value, 2012–2023
- Per Capita Consumption In 2012-2023
- Imports, In Physical Terms, By Country, 2012–2023
- Imports, In Value Terms, By Country, 2012–2023
- Import Prices, By Country Of Origin, 2012–2023
- Exports, In Physical Terms, By Country, 2012–2023
- Exports, In Value Terms, By Country, 2012–2023
- Export Prices, By Country Of Destination, 2012–2023
-
LIST OF FIGURES
- Market Volume, In Physical Terms, 2012–2023
- Market Value, 2012–2023
- Market Structure – Domestic Supply vs. Imports, In Physical Terms, 2012-2023
- Market Structure – Domestic Supply vs. Imports, In Value Terms, 2012-2023
- Trade Balance, In Physical Terms, 2012-2023
- Trade Balance, In Value Terms, 2012-2023
- Per Capita Consumption, 2012-2023
- Market Volume Forecast to 2030
- Market Value Forecast to 2030
- Products: Market Size And Growth, By Type
- Products: Average Per Capita Consumption, By Type
- Products: Exports And Growth, By Type
- Products: Export Prices And Growth, By Type
- Production Volume And Growth
- Exports And Growth
- Export Prices And Growth
- Market Size And Growth
- Per Capita Consumption
- Imports And Growth
- Import Prices
- Production, In Physical Terms, 2012–2023
- Production, In Value Terms, 2012–2023
- Imports, In Physical Terms, 2012–2023
- Imports, In Value Terms, 2012–2023
- Imports, In Physical Terms, By Country, 2023
- Imports, In Physical Terms, By Country, 2012–2023
- Imports, In Value Terms, By Country, 2012–2023
- Import Prices, By Country Of Origin, 2012–2023
- Exports, In Physical Terms, 2012–2023
- Exports, In Value Terms, 2012–2023
- Exports, In Physical Terms, By Country, 2023
- Exports, In Physical Terms, By Country, 2012–2023
- Exports, In Value Terms, By Country, 2012–2023
- Export Prices, By Country Of Destination, 2012–2023


