
India - Table Flatware - Market Analysis, Forecast, Size, Trends and Insights
Get instant access to more than 2 million reports, dashboards, and datasets on the IndexBox Platform.
View PricingSeptember 2023: India's Table Flatware Export Declines by 6% to $6.5M
India Table Flatware Exports
After four months of growth, overseas shipments of table flatware decreased by -6.6% to 1K tons in September 2023. In general, exports recorded a relatively flat trend pattern. The most prominent rate of growth was recorded in December 2022 with an increase of 29% m-o-m.
In value terms, table flatware exports shrank to $6.5M (IndexBox estimates) in September 2023. Overall, exports continue to indicate a relatively flat trend pattern. The most prominent rate of growth was recorded in August 2023 when exports increased by 16% against the previous month. As a result, the exports reached the peak of $6.9M, and then contracted in the following month.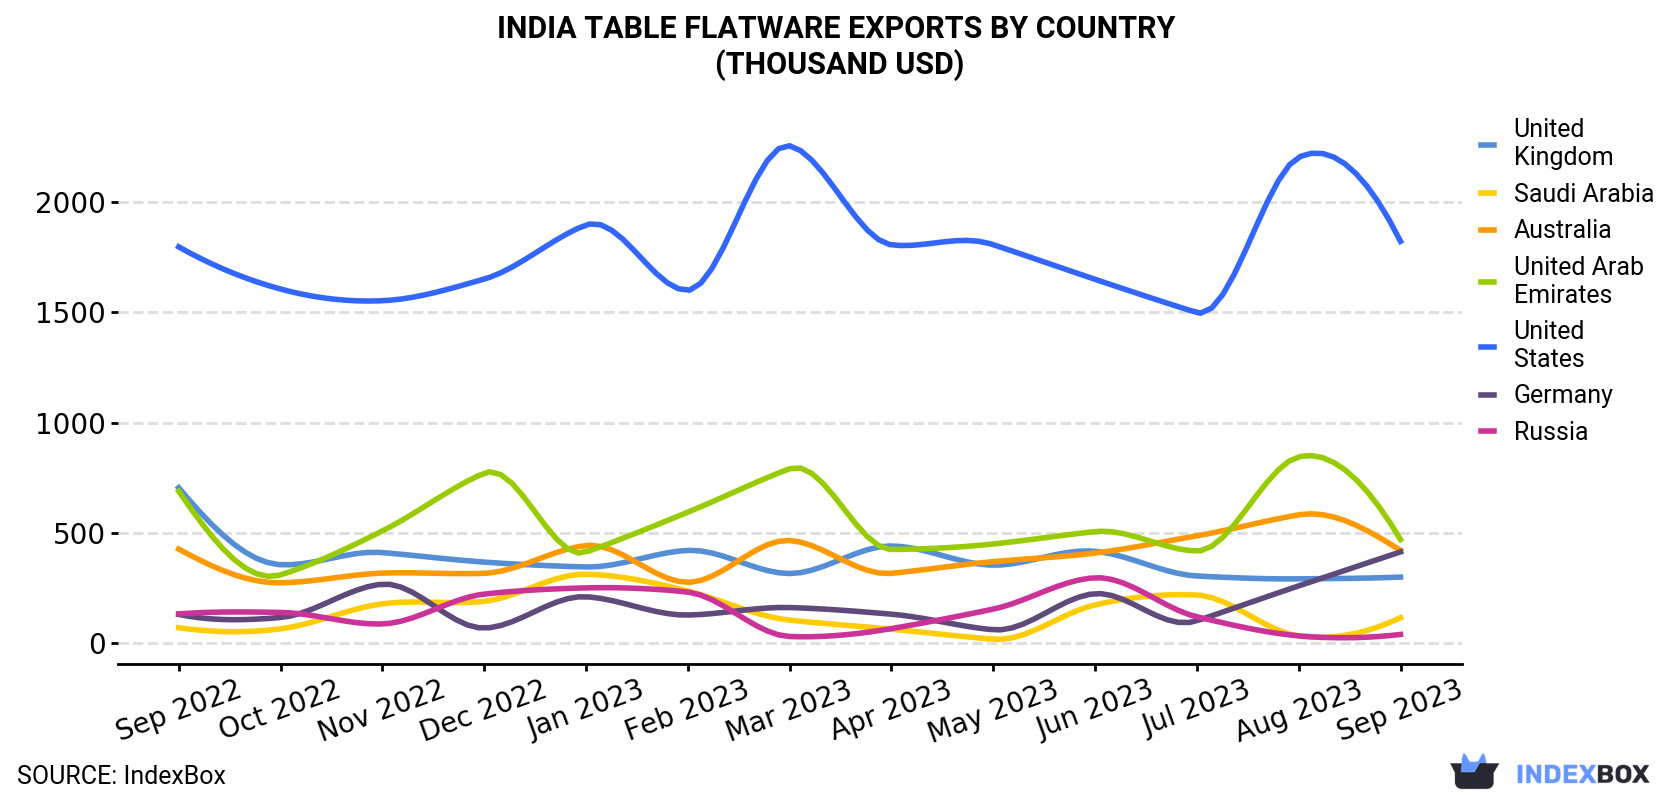
| COUNTRY | Export Value of Table Flatware in India (thousand USD) | ||||||||||||
|---|---|---|---|---|---|---|---|---|---|---|---|---|---|
| Sep 2022 | Oct 2022 | Nov 2022 | Dec 2022 | Jan 2023 | Feb 2023 | Mar 2023 | Apr 2023 | May 2023 | Jun 2023 | Jul 2023 | Aug 2023 | Sep 2023 | |
| United States | 1,796 | 1,605 | 1,552 | 1,650 | 1,895 | 1,599 | 2,254 | 1,805 | 1,806 | 1,649 | 1,498 | 2,202 | 1,821 |
| United Arab Emirates | 689 | 310 | 509 | 771 | 413 | 594 | 791 | 425 | 450 | 506 | 418 | 845 | 470 |
| Australia | 427 | 274 | 318 | 317 | 443 | 276 | 466 | 317 | 370 | 409 | 487 | 582 | 421 |
| Germany | 131 | 117 | 268 | 69.0 | 211 | 128 | 162 | 132 | 61.3 | 225 | 102 | 260 | 414 |
| United Kingdom | 705 | 356 | 411 | 368 | 346 | 421 | 316 | 441 | 354 | 417 | 305 | 292 | 300 |
| Saudi Arabia | 70.6 | 65.5 | 179 | 190 | 313 | 237 | 105 | 63.9 | 18.6 | 174 | 219 | 32.8 | 116 |
| Russia | 133 | 140 | 87.7 | 223 | 251 | 232 | 30.7 | 66.7 | 155 | 297 | 120 | 33.8 | 40.1 |
| Others | 2,825 | 2,364 | 1,862 | 2,330 | 2,312 | 2,294 | 2,159 | 2,274 | 2,006 | 2,094 | 2,792 | 2,649 | 2,934 |
| Total | 6,777 | 5,232 | 5,188 | 5,919 | 6,184 | 5,784 | 6,283 | 5,525 | 5,221 | 5,772 | 5,942 | 6,897 | 6,515 |
Exports by Country
The United States (202 tons) was the main destination for table flatware exports from India, accounting for a 20% share of total exports. Moreover, table flatware exports to the United States exceeded the volume sent to the second major destination, the United Arab Emirates (60 tons), threefold. The third position in this ranking was held by Australia (56 tons), with a 5.5% share.
From September 2022 to September 2023, the average monthly growth rate of volume to the United States was relatively modest. Exports to the other major destinations recorded the following average monthly rates of exports growth: the United Arab Emirates (-5.2% per month) and Australia (-0.2% per month).
In value terms, the United States ($1.8M) remains the key foreign market for table flatware exports from India, comprising 28% of total exports. The second position in the ranking was taken by the United Arab Emirates ($470K), with a 7.2% share of total exports. It was followed by Australia, with a 6.5% share.
From September 2022 to September 2023, the average monthly growth rate of value to the United States was relatively modest. Exports to the other major destinations recorded the following average monthly rates of exports growth: the United Arab Emirates (-3.1% per month) and Australia (-0.1% per month).
Exports by Type
Cutlery; other than plated with precious metal (918 tons) was the largest type of table flatware exported from India, with a 92% share of total exports. Moreover, cutlery; other than plated with precious metal exceeded the volume of the second product type, cutlery; sets of assorted articles (eg spoons, forks, ladles, skimmers, cake-servers, fish-knives, butter knives, sugar tongs and similar), not plated with precious metal (78 tons), more than tenfold. Cutlery; sets of assorted articles (eg spoons, forks, ladles, skimmers, cake-servers, fish-knives, butter-knives, sugar tongs and similar), with at least one article plated with precious metal (5.8 tons) ranked third in terms of total exports with a 0.6% share.
From September 2022 to September 2023, the average monthly growth rate of the volume of export of cutlery; other than plated with precious metal was relatively modest. With regard to the other exported products, the following average monthly rates of growth were recorded: cutlery; sets of assorted articles (eg spoons, forks, ladles, skimmers, cake-servers, fish-knives, butter knives, sugar tongs and similar), not plated with precious metal (-4.5% per month) and cutlery; sets of assorted articles (eg spoons, forks, ladles, skimmers, cake-servers, fish-knives, butter-knives, sugar tongs and similar), with at least one article plated with precious metal (+1.5% per month).
In value terms, cutlery; other than plated with precious metal ($5.5M) remains the largest type of table flatware exported from India, comprising 84% of total exports. The second position in the ranking was held by cutlery; sets of assorted articles (eg spoons, forks, ladles, skimmers, cake-servers, fish-knives, butter knives, sugar tongs and similar), not plated with precious metal ($971K), with a 15% share of total exports. It was followed by cutlery; sets of assorted articles (eg spoons, forks, ladles, skimmers, cake-servers, fish-knives, butter-knives, sugar tongs and similar), with at least one article plated with precious metal, with a 1% share.
From September 2022 to September 2023, the average monthly rate of growth in terms of the export volume of cutlery; other than plated with precious metal was relatively modest. With regard to the other exported products, the following average monthly rates of growth were recorded: cutlery; sets of assorted articles (eg spoons, forks, ladles, skimmers, cake-servers, fish-knives, butter knives, sugar tongs and similar), not plated with precious metal (-1.8% per month) and cutlery; sets of assorted articles (eg spoons, forks, ladles, skimmers, cake-servers, fish-knives, butter-knives, sugar tongs and similar), with at least one article plated with precious metal (+2.3% per month).
Export Prices by Country
In September 2023, the table flatware price amounted to $6,505 per ton (FOB, India), remaining constant against the previous month. Overall, the export price, however, recorded a relatively flat trend pattern. The pace of growth appeared the most rapid in March 2023 an increase of 16% month-to-month. The export price peaked at $6,926 per ton in November 2022; however, from December 2022 to September 2023, the export prices failed to regain momentum.
Prices varied noticeably by the country of destination: the country with the highest price was Germany ($17,022 per ton), while the average price for exports to Ukraine ($1,969 per ton) was amongst the lowest.
From September 2022 to September 2023, the most notable rate of growth in terms of prices was recorded for supplies to Germany (+4.0%), while the prices for the other major destinations experienced more modest paces of growth.
This report provides an in-depth analysis of the table flatware market in India. Within it, you will discover the latest data on market trends and opportunities by country, consumption, production and price developments, as well as the global trade (imports and exports). The forecast exhibits the market prospects through 2030.
Product coverage:
- Prodcom 25711430 - Table flatware (excluding table knives, including fish-knives and butter-knives) and similar tableware of stainless steel or other base metal
- Prodcom 25711480 - Table flatware (excluding table knives, including fish-knives and butter-knives) and similar tableware of base metal, silver- , gold- or platinum plated
Country coverage:
- India
Data coverage:
- Market volume and value
- Per Capita consumption
- Forecast of the market dynamics in the medium term
- Trade (exports and imports) in India
- Export and import prices
- Market trends, drivers and restraints
- Key market players and their profiles
Reasons to buy this report:
- Take advantage of the latest data
- Find deeper insights into current market developments
- Discover vital success factors affecting the market
This report is designed for manufacturers, distributors, importers, and wholesalers, as well as for investors, consultants and advisors.
In this report, you can find information that helps you to make informed decisions on the following issues:
- How to diversify your business and benefit from new market opportunities
- How to load your idle production capacity
- How to boost your sales on overseas markets
- How to increase your profit margins
- How to make your supply chain more sustainable
- How to reduce your production and supply chain costs
- How to outsource production to other countries
- How to prepare your business for global expansion
While doing this research, we combine the accumulated expertise of our analysts and the capabilities of artificial intelligence. The AI-based platform, developed by our data scientists, constitutes the key working tool for business analysts, empowering them to discover deep insights and ideas from the marketing data.
-
1. INTRODUCTION
Making Data-Driven Decisions to Grow Your Business
- REPORT DESCRIPTION
- RESEARCH METHODOLOGY AND AI PLATFORM
- DATA-DRIVEN DECISIONS FOR YOUR BUSINESS
- GLOSSARY AND SPECIFIC TERMS
-
2. EXECUTIVE SUMMARY
A Quick Overview of Market Performance
- KEY FINDINGS
- MARKET TRENDS This Chapter is Available Only for the Professional Edition PRO
-
3. MARKET OVERVIEW
Understanding the Current State of The Market and Its Prospects
- MARKET SIZE
- MARKET STRUCTURE
- TRADE BALANCE
- PER CAPITA CONSUMPTION
- MARKET FORECAST TO 2030
-
4. MOST PROMISING PRODUCT
Finding New Products to Diversify Your Business
This Chapter is Available Only for the Professional Edition PRO- TOP PRODUCTS TO DIVERSIFY YOUR BUSINESS
- BEST-SELLING PRODUCTS
- MOST CONSUMED PRODUCT
- MOST TRADED PRODUCT
- MOST PROFITABLE PRODUCT FOR EXPORT
-
5. MOST PROMISING SUPPLYING COUNTRIES
Choosing the Best Countries to Establish Your Sustainable Supply Chain
This Chapter is Available Only for the Professional Edition PRO- TOP COUNTRIES TO SOURCE YOUR PRODUCT
- TOP PRODUCING COUNTRIES
- TOP EXPORTING COUNTRIES
- LOW-COST EXPORTING COUNTRIES
-
6. MOST PROMISING OVERSEAS MARKETS
Choosing the Best Countries to Boost Your Exports
This Chapter is Available Only for the Professional Edition PRO- TOP OVERSEAS MARKETS FOR EXPORTING YOUR PRODUCT
- TOP CONSUMING MARKETS
- UNSATURATED MARKETS
- TOP IMPORTING MARKETS
- MOST PROFITABLE MARKETS
7. PRODUCTION
The Latest Trends and Insights into The Industry
- PRODUCTION VOLUME AND VALUE
8. IMPORTS
The Largest Import Supplying Countries
- IMPORTS FROM 2012–2023
- IMPORTS BY COUNTRY
- IMPORT PRICES BY COUNTRY
9. EXPORTS
The Largest Destinations for Exports
- EXPORTS FROM 2012–2023
- EXPORTS BY COUNTRY
- EXPORT PRICES BY COUNTRY
-
10. PROFILES OF MAJOR PRODUCERS
The Largest Producers on The Market and Their Profiles
This Chapter is Available Only for the Professional Edition PRO -
LIST OF TABLES
- Key Findings In 2023
- Market Volume, In Physical Terms, 2012–2023
- Market Value, 2012–2023
- Per Capita Consumption In 2012-2023
- Imports, In Physical Terms, By Country, 2012–2023
- Imports, In Value Terms, By Country, 2012–2023
- Import Prices, By Country Of Origin, 2012–2023
- Exports, In Physical Terms, By Country, 2012–2023
- Exports, In Value Terms, By Country, 2012–2023
- Export Prices, By Country Of Destination, 2012–2023
-
LIST OF FIGURES
- Market Volume, In Physical Terms, 2012–2023
- Market Value, 2012–2023
- Market Structure – Domestic Supply vs. Imports, In Physical Terms, 2012-2023
- Market Structure – Domestic Supply vs. Imports, In Value Terms, 2012-2023
- Trade Balance, In Physical Terms, 2012-2023
- Trade Balance, In Value Terms, 2012-2023
- Per Capita Consumption, 2012-2023
- Market Volume Forecast to 2030
- Market Value Forecast to 2030
- Products: Market Size And Growth, By Type
- Products: Average Per Capita Consumption, By Type
- Products: Exports And Growth, By Type
- Products: Export Prices And Growth, By Type
- Production Volume And Growth
- Exports And Growth
- Export Prices And Growth
- Market Size And Growth
- Per Capita Consumption
- Imports And Growth
- Import Prices
- Production, In Physical Terms, 2012–2023
- Production, In Value Terms, 2012–2023
- Imports, In Physical Terms, 2012–2023
- Imports, In Value Terms, 2012–2023
- Imports, In Physical Terms, By Country, 2023
- Imports, In Physical Terms, By Country, 2012–2023
- Imports, In Value Terms, By Country, 2012–2023
- Import Prices, By Country Of Origin, 2012–2023
- Exports, In Physical Terms, 2012–2023
- Exports, In Value Terms, 2012–2023
- Exports, In Physical Terms, By Country, 2023
- Exports, In Physical Terms, By Country, 2012–2023
- Exports, In Value Terms, By Country, 2012–2023
- Export Prices, By Country Of Destination, 2012–2023


