
China - Polystyrene, In Primary Forms - Market Analysis, Forecast, Size, Trends and Insights
Get instant access to more than 2 million reports, dashboards, and datasets on the IndexBox Platform.
View PricingChinese Import of Polystyrene Drops to $707M by 2023
China Polystyrene Imports
In 2023, purchases abroad of polystyrene decreased by -30% to 633K tons, falling for the third year in a row after four years of growth. Over the period under review, imports recorded a pronounced descent. The pace of growth was the most pronounced in 2018 when imports increased by 58%. Over the period under review, imports hit record highs at 1.4M tons in 2020; however, from 2021 to 2023, imports failed to regain momentum.
In value terms, polystyrene imports reduced remarkably to $707M (IndexBox estimates) in 2023. Overall, imports continue to indicate a abrupt setback. The pace of growth appeared the most rapid in 2018 with an increase of 48%. Imports peaked at $1.7B in 2013; however, from 2014 to 2023, imports remained at a lower figure.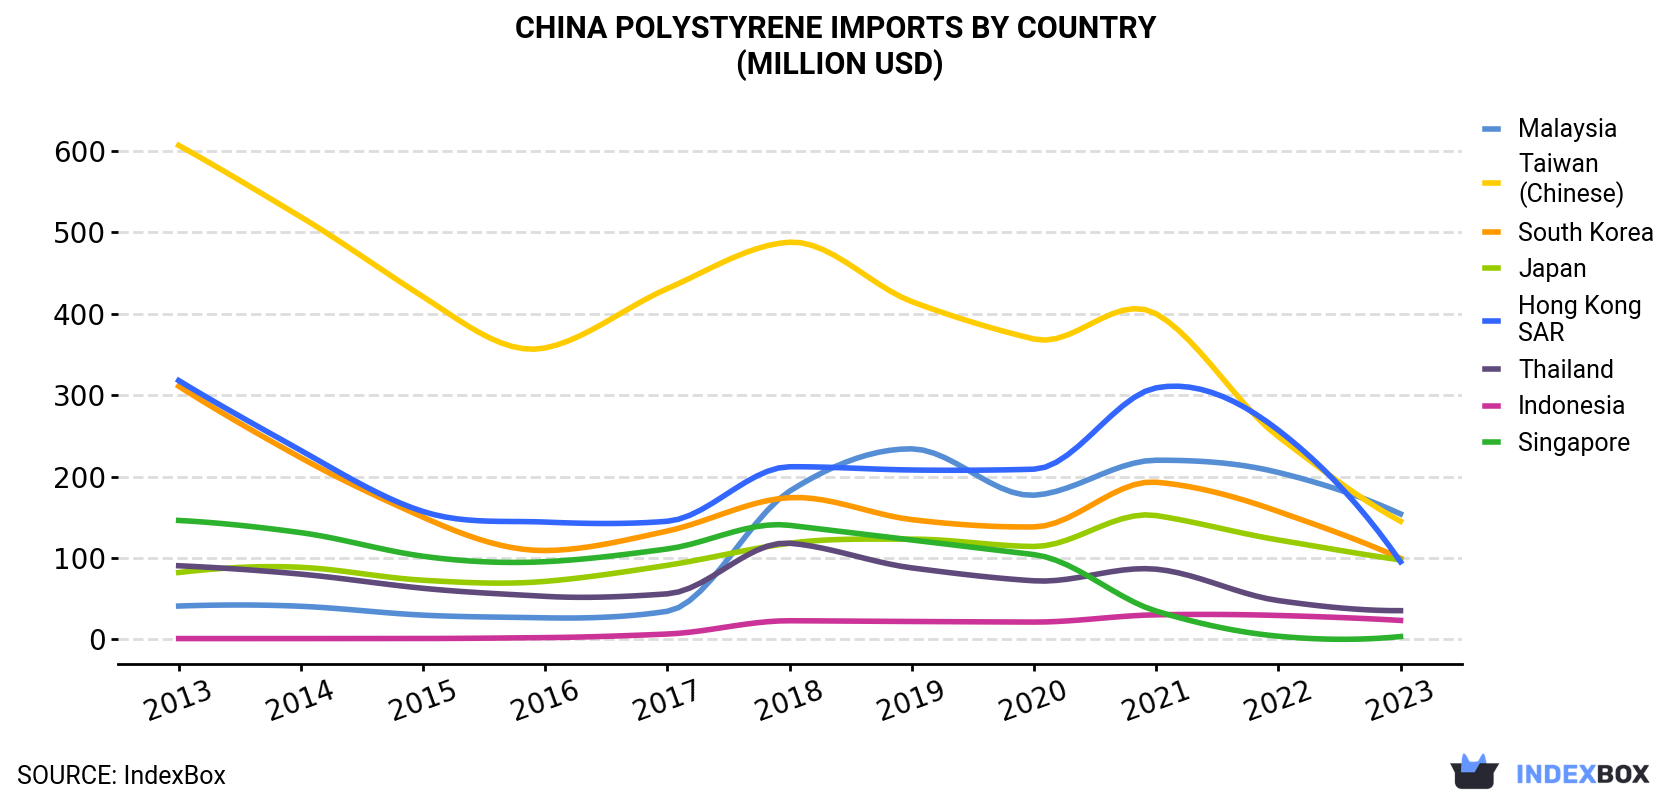
| COUNTRY | Import Value of Polystyrene in China (million USD) | ||||||||||
|---|---|---|---|---|---|---|---|---|---|---|---|
| 2013 | 2014 | 2015 | 2016 | 2017 | 2018 | 2019 | 2020 | 2021 | 2022 | 2023 | |
| Malaysia | 40.8 | 40.5 | 29.6 | 26.3 | 34.4 | 182 | 234 | 177 | 220 | 205 | 154 |
| Taiwan (Chinese) | 607 | 519 | 421 | 358 | 431 | 488 | 415 | 369 | 400 | 249 | 145 |
| South Korea | 311 | 223 | 150 | 109 | 133 | 174 | 147 | 138 | 193 | 157 | 99.4 |
| Japan | 82.0 | 88.4 | 72.5 | 71.1 | 90.9 | 118 | 123 | 114 | 152 | 122 | 97.4 |
| Hong Kong | 318 | 232 | 157 | 144 | 145 | 212 | 208 | 209 | 309 | 257 | 95.2 |
| Thailand | 90.3 | 80.0 | 62.6 | 52.7 | 55.8 | 118 | 87.7 | 71.8 | 86.1 | 47.5 | 35.1 |
| Indonesia | 0.8 | 0.8 | 0.9 | 2.0 | 6.4 | 22.7 | 21.8 | 21.1 | 30.0 | 29.2 | 23.1 |
| Singapore | 146 | 131 | 102 | 95.3 | 111 | 140 | 122 | 104 | 34.6 | 3.7 | 3.3 |
| Others | 122 | 184 | 116 | 69.4 | 87.1 | 169 | 230 | 234 | 193 | 102 | 54.5 |
| Total | 1,718 | 1,498 | 1,111 | 927 | 1,095 | 1,624 | 1,589 | 1,439 | 1,618 | 1,173 | 707 |
Imports by Country
Malaysia (173K tons), Taiwan (Chinese) (109K tons) and Japan (82K tons) were the main suppliers of polystyrene imports to China, together accounting for 58% of total imports. South Korea, Hong Kong, Thailand, Indonesia and Singapore lagged somewhat behind, together accounting for a further 36%.
From 2013 to 2023, the biggest increases were recorded for Indonesia (with a CAGR of +45.5%), while purchases for the other leaders experienced more modest paces of growth.
In value terms, Malaysia ($154M), Taiwan (Chinese) ($145M) and South Korea ($99M) constituted the largest polystyrene suppliers to China, with a combined 56% share of total imports. Japan, Hong Kong, Thailand, Indonesia and Singapore lagged somewhat behind, together comprising a further 36%.
In terms of the main suppliers, Indonesia, with a CAGR of +40.6%, recorded the highest growth rate of the value of imports, over the period under review, while purchases for the other leaders experienced more modest paces of growth.
Imports by Type
In 2023, polystyrene in primary forms (excluding expansible polystyrene) (624K tons) was the main type of polystyrene supplied to China, with a 98% share of total imports. It was followed by expansible polystyrene in primary forms (9.6K tons), with a 1.5% share of total imports.
From 2013 to 2023, the average annual growth rate of the volume of polystyrene in primary forms (excluding expansible polystyrene) imports amounted to -3.3%.
In value terms, polystyrene in primary forms (excluding expansible polystyrene) ($691M) constituted the largest type of polystyrene supplied to China, comprising 98% of total imports. The second position in the ranking was taken by expansible polystyrene in primary forms ($17M), with a 2.4% share of total imports.
Import Prices by Country
In 2023, the polystyrene price amounted to $1,116 per ton (CIF, China), reducing by -13.9% against the previous year. Over the period under review, the import price saw a pronounced contraction. The most prominent rate of growth was recorded in 2021 when the average import price increased by 28%. The import price peaked at $1,844 per ton in 2013; however, from 2014 to 2023, import prices stood at a somewhat lower figure.
There were significant differences in the average prices amongst the major supplying countries. In 2023, amid the top importers, the country with the highest price was Singapore ($1,373 per ton), while the price for Indonesia ($782 per ton) was amongst the lowest.
From 2013 to 2023, the most notable rate of growth in terms of prices was attained by Taiwan (Chinese) (-2.8%), while the prices for the other major suppliers experienced a decline.
This report provides an in-depth analysis of the polystyrene market in China. Within it, you will discover the latest data on market trends and opportunities by country, consumption, production and price developments, as well as the global trade (imports and exports). The forecast exhibits the market prospects through 2030.
Product coverage:
- Prodcom 20162035 - Expansible polystyrene, in primary forms
- Prodcom 20162039 - Polystyrene, in primary forms (excluding expansible polystyrene)
Country coverage:
Data coverage:
- Market volume and value
- Per Capita consumption
- Forecast of the market dynamics in the medium term
- Trade (exports and imports) in China
- Export and import prices
- Market trends, drivers and restraints
- Key market players and their profiles
Reasons to buy this report:
- Take advantage of the latest data
- Find deeper insights into current market developments
- Discover vital success factors affecting the market
This report is designed for manufacturers, distributors, importers, and wholesalers, as well as for investors, consultants and advisors.
In this report, you can find information that helps you to make informed decisions on the following issues:
- How to diversify your business and benefit from new market opportunities
- How to load your idle production capacity
- How to boost your sales on overseas markets
- How to increase your profit margins
- How to make your supply chain more sustainable
- How to reduce your production and supply chain costs
- How to outsource production to other countries
- How to prepare your business for global expansion
While doing this research, we combine the accumulated expertise of our analysts and the capabilities of artificial intelligence. The AI-based platform, developed by our data scientists, constitutes the key working tool for business analysts, empowering them to discover deep insights and ideas from the marketing data.
-
1. INTRODUCTION
Making Data-Driven Decisions to Grow Your Business
- REPORT DESCRIPTION
- RESEARCH METHODOLOGY AND AI PLATFORM
- DATA-DRIVEN DECISIONS FOR YOUR BUSINESS
- GLOSSARY AND SPECIFIC TERMS
-
2. EXECUTIVE SUMMARY
A Quick Overview of Market Performance
- KEY FINDINGS
- MARKET TRENDS This Chapter is Available Only for the Professional Edition PRO
-
3. MARKET OVERVIEW
Understanding the Current State of The Market and Its Prospects
- MARKET SIZE
- MARKET STRUCTURE
- TRADE BALANCE
- PER CAPITA CONSUMPTION
- MARKET FORECAST TO 2030
-
4. MOST PROMISING PRODUCT
Finding New Products to Diversify Your Business
This Chapter is Available Only for the Professional Edition PRO- TOP PRODUCTS TO DIVERSIFY YOUR BUSINESS
- BEST-SELLING PRODUCTS
- MOST CONSUMED PRODUCT
- MOST TRADED PRODUCT
- MOST PROFITABLE PRODUCT FOR EXPORT
-
5. MOST PROMISING SUPPLYING COUNTRIES
Choosing the Best Countries to Establish Your Sustainable Supply Chain
This Chapter is Available Only for the Professional Edition PRO- TOP COUNTRIES TO SOURCE YOUR PRODUCT
- TOP PRODUCING COUNTRIES
- TOP EXPORTING COUNTRIES
- LOW-COST EXPORTING COUNTRIES
-
6. MOST PROMISING OVERSEAS MARKETS
Choosing the Best Countries to Boost Your Exports
This Chapter is Available Only for the Professional Edition PRO- TOP OVERSEAS MARKETS FOR EXPORTING YOUR PRODUCT
- TOP CONSUMING MARKETS
- UNSATURATED MARKETS
- TOP IMPORTING MARKETS
- MOST PROFITABLE MARKETS
7. PRODUCTION
The Latest Trends and Insights into The Industry
- PRODUCTION VOLUME AND VALUE
8. IMPORTS
The Largest Import Supplying Countries
- IMPORTS FROM 2012–2023
- IMPORTS BY COUNTRY
- IMPORT PRICES BY COUNTRY
9. EXPORTS
The Largest Destinations for Exports
- EXPORTS FROM 2012–2023
- EXPORTS BY COUNTRY
- EXPORT PRICES BY COUNTRY
-
10. PROFILES OF MAJOR PRODUCERS
The Largest Producers on The Market and Their Profiles
This Chapter is Available Only for the Professional Edition PRO -
LIST OF TABLES
- Key Findings In 2023
- Market Volume, In Physical Terms, 2012–2023
- Market Value, 2012–2023
- Per Capita Consumption In 2012-2023
- Imports, In Physical Terms, By Country, 2012–2023
- Imports, In Value Terms, By Country, 2012–2023
- Import Prices, By Country Of Origin, 2012–2023
- Exports, In Physical Terms, By Country, 2012–2023
- Exports, In Value Terms, By Country, 2012–2023
- Export Prices, By Country Of Destination, 2012–2023
-
LIST OF FIGURES
- Market Volume, In Physical Terms, 2012–2023
- Market Value, 2012–2023
- Market Structure – Domestic Supply vs. Imports, In Physical Terms, 2012-2023
- Market Structure – Domestic Supply vs. Imports, In Value Terms, 2012-2023
- Trade Balance, In Physical Terms, 2012-2023
- Trade Balance, In Value Terms, 2012-2023
- Per Capita Consumption, 2012-2023
- Market Volume Forecast to 2030
- Market Value Forecast to 2030
- Products: Market Size And Growth, By Type
- Products: Average Per Capita Consumption, By Type
- Products: Exports And Growth, By Type
- Products: Export Prices And Growth, By Type
- Production Volume And Growth
- Exports And Growth
- Export Prices And Growth
- Market Size And Growth
- Per Capita Consumption
- Imports And Growth
- Import Prices
- Production, In Physical Terms, 2012–2023
- Production, In Value Terms, 2012–2023
- Imports, In Physical Terms, 2012–2023
- Imports, In Value Terms, 2012–2023
- Imports, In Physical Terms, By Country, 2023
- Imports, In Physical Terms, By Country, 2012–2023
- Imports, In Value Terms, By Country, 2012–2023
- Import Prices, By Country Of Origin, 2012–2023
- Exports, In Physical Terms, 2012–2023
- Exports, In Value Terms, 2012–2023
- Exports, In Physical Terms, By Country, 2023
- Exports, In Physical Terms, By Country, 2012–2023
- Exports, In Value Terms, By Country, 2012–2023
- Export Prices, By Country Of Destination, 2012–2023


