
Brazil - Mattresses - Market Analysis, Forecast, Size, Trends and Insights
Get instant access to more than 2 million reports, dashboards, and datasets on the IndexBox Platform.
View Pricing14% Surge in Brazil's Mattress Prices, Averaging $91.9 per Unit
Brazil Mattress Export Price in July 2023
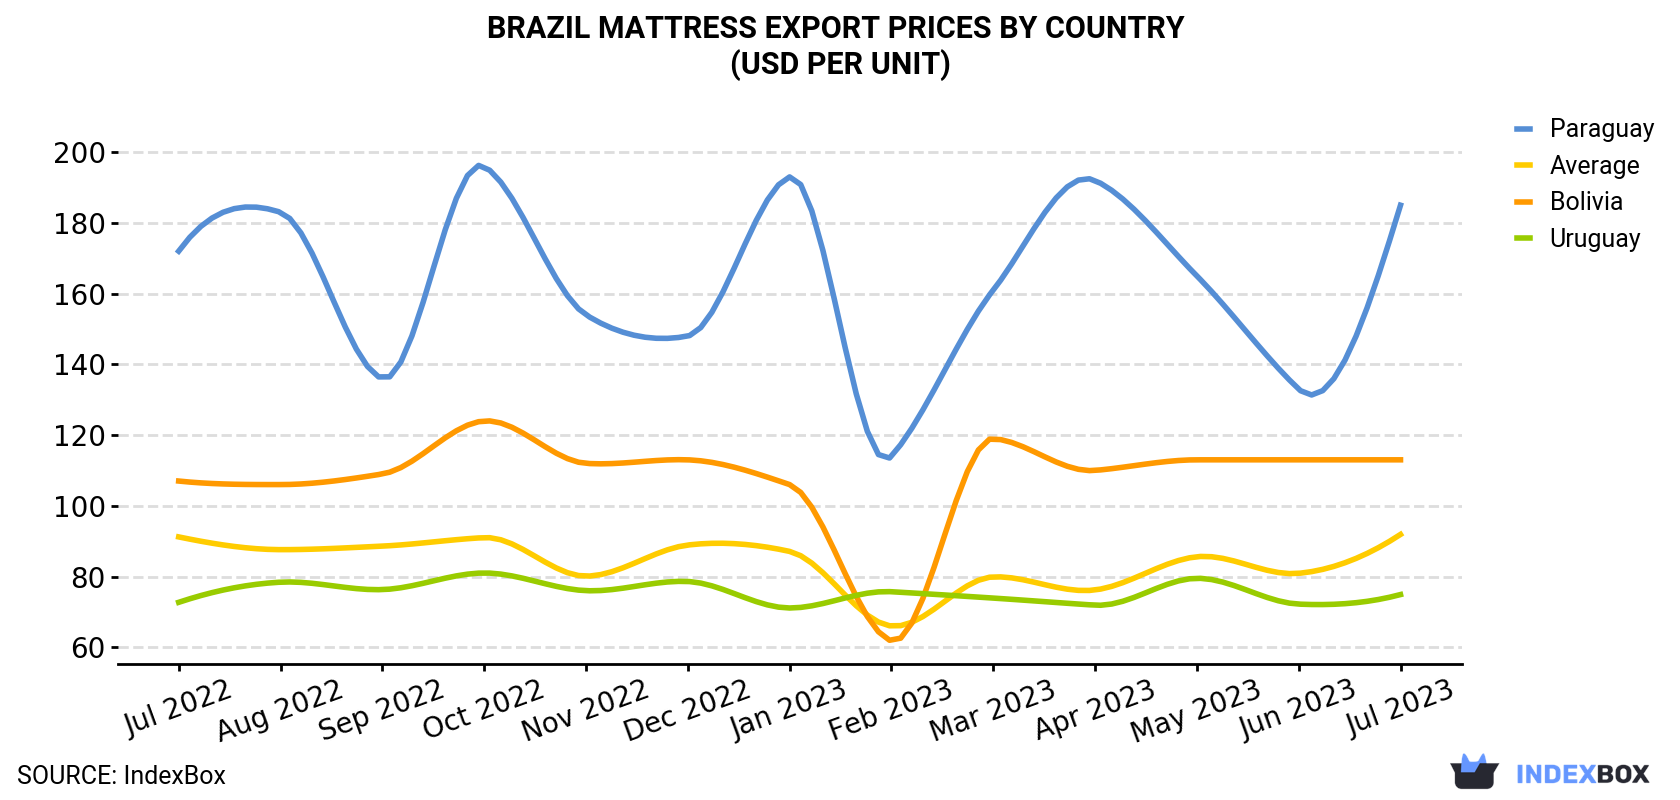
In July 2023, the mattress price amounted to $91.9 per unit (FOB, Brazil), with an increase of 14% against the previous month. In general, the export price recorded a relatively flat trend pattern. The growth pace was the most rapid in March 2023 an increase of 21% m-o-m. Over the period under review, the average export prices attained the maximum in July 2023.
Prices varied noticeably by the country of destination: the country with the highest price was Paraguay ($185 per unit), while the average price for exports to Uruguay ($74.9 per unit) was amongst the lowest.
From July 2022 to July 2023, the most notable rate of growth in terms of prices was recorded for supplies to Paraguay (+0.6%), while the prices for the other major destinations experienced more modest paces of growth.
| COUNTRY | Export Price of Mattress in Brazil (USD per unit) | ||||||||||||
|---|---|---|---|---|---|---|---|---|---|---|---|---|---|
| Jul 2022 | Aug 2022 | Sep 2022 | Oct 2022 | Nov 2022 | Dec 2022 | Jan 2023 | Feb 2023 | Mar 2023 | Apr 2023 | May 2023 | Jun 2023 | Jul 2023 | |
| Paraguay | 172 | 183 | 136 | 196 | 154 | 148 | 193 | 114 | 161 | 192 | 165 | 133 | 185 |
| Bolivia | 107 | 106 | 109 | 124 | 112 | 113 | 106 | 61.8 | 119 | 110 | 113 | 113 | 113 |
| Uruguay | 72.7 | 78.4 | 76.3 | 81.0 | 76.0 | 78.6 | 71.1 | 75.7 | 73.9 | 71.9 | 79.5 | 72.2 | 74.9 |
| Average | 91.2 | 87.6 | 88.6 | 91.0 | 80.1 | 88.9 | 87.1 | 66.0 | 79.9 | 76.2 | 85.6 | 80.9 | 91.9 |
Brazil Mattress Export Prices by Type
There were significant differences in the average prices for the major types of exported product. In July 2023, the product with the highest price was mattresses other than of cellular rubber or plastics ($108 per unit), while the average price for exports of mattresses of cellular rubber or plastics stood at $65.4 per unit.
From July 2022 to July 2023, the most notable rate of growth in terms of prices was recorded for the following types: mattresses other than of cellular rubber or plastics (+0.6%).
Brazil Mattress Exports
In July 2023, overseas shipments of mattresses decreased by -16.2% to 18K units for the first time since April 2023, thus ending a two-month rising trend. Over the period under review, exports, however, recorded a relatively flat trend pattern. The pace of growth appeared the most rapid in February 2023 with an increase of 63% m-o-m. As a result, the exports attained the peak of 26K units. From March 2023 to July 2023, the growth of the exports remained at a lower figure.
In value terms, mattress exports reduced slightly to $1.6M (IndexBox estimates) in July 2023. Overall, exports, however, saw a relatively flat trend pattern. The pace of growth was the most pronounced in December 2022 with an increase of 72% m-o-m. As a result, the exports reached the peak of $2M. From January 2023 to July 2023, the growth of the exports failed to regain momentum.
Brazil Mattress Exports by Type
Mattresses other than of cellular rubber or plastics (11K units) and mattresses of cellular rubber or plastics (6.6K units) were the main products of mattress exports from Brazil.
From July 2022 to July 2023, the most notable rate of growth in terms of shipments, amongst the major product types, was attained by mattresses of cellular rubber or plastics (with a CAGR of +2.1%).
In value terms, mattresses other than of cellular rubber or plastics ($1.2M) remains the largest type of mattress exported from Brazil, comprising 73% of total exports. The second position in the ranking was taken by mattresses of cellular rubber or plastics ($435K), with a 27% share of total exports.
From July 2022 to July 2023, the average monthly rate of growth in terms of the export volume of mattresses other than of cellular rubber or plastics was relatively modest.
Brazil Mattress Exports by Country
Uruguay (10K units), Bolivia (6.9K units) and Paraguay (297 units) were the main destinations of mattress exports from Brazil, with a combined 98% share of total exports.
From July 2022 to July 2023, the most notable rate of growth in terms of shipments, amongst the main countries of destination, was attained by Uruguay (with a CAGR of +1.2%), while the other leaders experienced mixed trend patterns.
In value terms, Bolivia ($772K), Uruguay ($754K) and Paraguay ($55K) constituted the largest markets for mattress exported from Brazil worldwide, with a combined 98% share of total exports.
In terms of the main countries of destination, Uruguay, with a CAGR of +1.5%, saw the highest growth rate of the value of exports, over the period under review, while shipments for the other leaders experienced mixed trend patterns.
This report provides an in-depth analysis of the mattress market in Brazil. Within it, you will discover the latest data on market trends and opportunities by country, consumption, production and price developments, as well as the global trade (imports and exports). The forecast exhibits the market prospects through 2030.
Product coverage:
- Prodcom 31031230 - Mattresses of cellular rubber (including with a metal frame) (excluding water-mattresses, pneumatic mattresses)
- Prodcom 31031250 - Mattresses of cellular plastics (including with a metal frame) (excluding water-mattresses, pneumatic mattresses)
- Prodcom 31031270 - Mattresses with spring interiors (excluding of cellular rubber or plastics)
- Prodcom 31031290 - Mattresses (excluding with spring interiors, of cellular rubber or plastics)
Country coverage:
- Brazil
Data coverage:
- Market volume and value
- Per Capita consumption
- Forecast of the market dynamics in the medium term
- Trade (exports and imports) in Brazil
- Export and import prices
- Market trends, drivers and restraints
- Key market players and their profiles
Reasons to buy this report:
- Take advantage of the latest data
- Find deeper insights into current market developments
- Discover vital success factors affecting the market
This report is designed for manufacturers, distributors, importers, and wholesalers, as well as for investors, consultants and advisors.
In this report, you can find information that helps you to make informed decisions on the following issues:
- How to diversify your business and benefit from new market opportunities
- How to load your idle production capacity
- How to boost your sales on overseas markets
- How to increase your profit margins
- How to make your supply chain more sustainable
- How to reduce your production and supply chain costs
- How to outsource production to other countries
- How to prepare your business for global expansion
While doing this research, we combine the accumulated expertise of our analysts and the capabilities of artificial intelligence. The AI-based platform, developed by our data scientists, constitutes the key working tool for business analysts, empowering them to discover deep insights and ideas from the marketing data.
-
1. INTRODUCTION
Making Data-Driven Decisions to Grow Your Business
- REPORT DESCRIPTION
- RESEARCH METHODOLOGY AND AI PLATFORM
- DATA-DRIVEN DECISIONS FOR YOUR BUSINESS
- GLOSSARY AND SPECIFIC TERMS
-
2. EXECUTIVE SUMMARY
A Quick Overview of Market Performance
- KEY FINDINGS
- MARKET TRENDS This Chapter is Available Only for the Professional Edition PRO
-
3. MARKET OVERVIEW
Understanding the Current State of The Market and Its Prospects
- MARKET SIZE
- MARKET STRUCTURE
- TRADE BALANCE
- PER CAPITA CONSUMPTION
- MARKET FORECAST TO 2030
-
4. MOST PROMISING PRODUCT
Finding New Products to Diversify Your Business
This Chapter is Available Only for the Professional Edition PRO- TOP PRODUCTS TO DIVERSIFY YOUR BUSINESS
- BEST-SELLING PRODUCTS
- MOST CONSUMED PRODUCT
- MOST TRADED PRODUCT
- MOST PROFITABLE PRODUCT FOR EXPORT
-
5. MOST PROMISING SUPPLYING COUNTRIES
Choosing the Best Countries to Establish Your Sustainable Supply Chain
This Chapter is Available Only for the Professional Edition PRO- TOP COUNTRIES TO SOURCE YOUR PRODUCT
- TOP PRODUCING COUNTRIES
- TOP EXPORTING COUNTRIES
- LOW-COST EXPORTING COUNTRIES
-
6. MOST PROMISING OVERSEAS MARKETS
Choosing the Best Countries to Boost Your Exports
This Chapter is Available Only for the Professional Edition PRO- TOP OVERSEAS MARKETS FOR EXPORTING YOUR PRODUCT
- TOP CONSUMING MARKETS
- UNSATURATED MARKETS
- TOP IMPORTING MARKETS
- MOST PROFITABLE MARKETS
7. PRODUCTION
The Latest Trends and Insights into The Industry
- PRODUCTION VOLUME AND VALUE
8. IMPORTS
The Largest Import Supplying Countries
- IMPORTS FROM 2012–2023
- IMPORTS BY COUNTRY
- IMPORT PRICES BY COUNTRY
9. EXPORTS
The Largest Destinations for Exports
- EXPORTS FROM 2012–2023
- EXPORTS BY COUNTRY
- EXPORT PRICES BY COUNTRY
-
10. PROFILES OF MAJOR PRODUCERS
The Largest Producers on The Market and Their Profiles
This Chapter is Available Only for the Professional Edition PRO -
LIST OF TABLES
- Key Findings In 2023
- Market Volume, In Physical Terms, 2012–2023
- Market Value, 2012–2023
- Per Capita Consumption In 2012-2023
- Imports, In Physical Terms, By Country, 2012–2023
- Imports, In Value Terms, By Country, 2012–2023
- Import Prices, By Country Of Origin, 2012–2023
- Exports, In Physical Terms, By Country, 2012–2023
- Exports, In Value Terms, By Country, 2012–2023
- Export Prices, By Country Of Destination, 2012–2023
-
LIST OF FIGURES
- Market Volume, In Physical Terms, 2012–2023
- Market Value, 2012–2023
- Market Structure – Domestic Supply vs. Imports, In Physical Terms, 2012-2023
- Market Structure – Domestic Supply vs. Imports, In Value Terms, 2012-2023
- Trade Balance, In Physical Terms, 2012-2023
- Trade Balance, In Value Terms, 2012-2023
- Per Capita Consumption, 2012-2023
- Market Volume Forecast to 2030
- Market Value Forecast to 2030
- Products: Market Size And Growth, By Type
- Products: Average Per Capita Consumption, By Type
- Products: Exports And Growth, By Type
- Products: Export Prices And Growth, By Type
- Production Volume And Growth
- Exports And Growth
- Export Prices And Growth
- Market Size And Growth
- Per Capita Consumption
- Imports And Growth
- Import Prices
- Production, In Physical Terms, 2012–2023
- Production, In Value Terms, 2012–2023
- Imports, In Physical Terms, 2012–2023
- Imports, In Value Terms, 2012–2023
- Imports, In Physical Terms, By Country, 2023
- Imports, In Physical Terms, By Country, 2012–2023
- Imports, In Value Terms, By Country, 2012–2023
- Import Prices, By Country Of Origin, 2012–2023
- Exports, In Physical Terms, 2012–2023
- Exports, In Value Terms, 2012–2023
- Exports, In Physical Terms, By Country, 2023
- Exports, In Physical Terms, By Country, 2012–2023
- Exports, In Value Terms, By Country, 2012–2023
- Export Prices, By Country Of Destination, 2012–2023


