
Brazil - Heterocyclic Compounds - Market Analysis, Forecast, Size, Trends and Insights
Get instant access to more than 2 million reports, dashboards, and datasets on the IndexBox Platform.
View PricingBrazil's Import of Heterocyclic Compounds Drops Significantly to $1.1B in 2023
Brazil Heterocyclic Compound Imports
Heterocyclic compound imports into Brazil fell rapidly to 28K tons in 2023, which is down by -24.8% on 2022 figures. Overall, imports saw a pronounced contraction. The most prominent rate of growth was recorded in 2018 when imports increased by 35% against the previous year. Imports peaked at 64K tons in 2019; however, from 2020 to 2023, imports failed to regain momentum.
In value terms, heterocyclic compound imports contracted dramatically to $1.1B (IndexBox estimates) in 2023. Over the period under review, imports, however, showed a resilient expansion. The pace of growth was the most pronounced in 2022 with an increase of 41% against the previous year. As a result, imports reached the peak of $1.4B, and then reduced rapidly in the following year.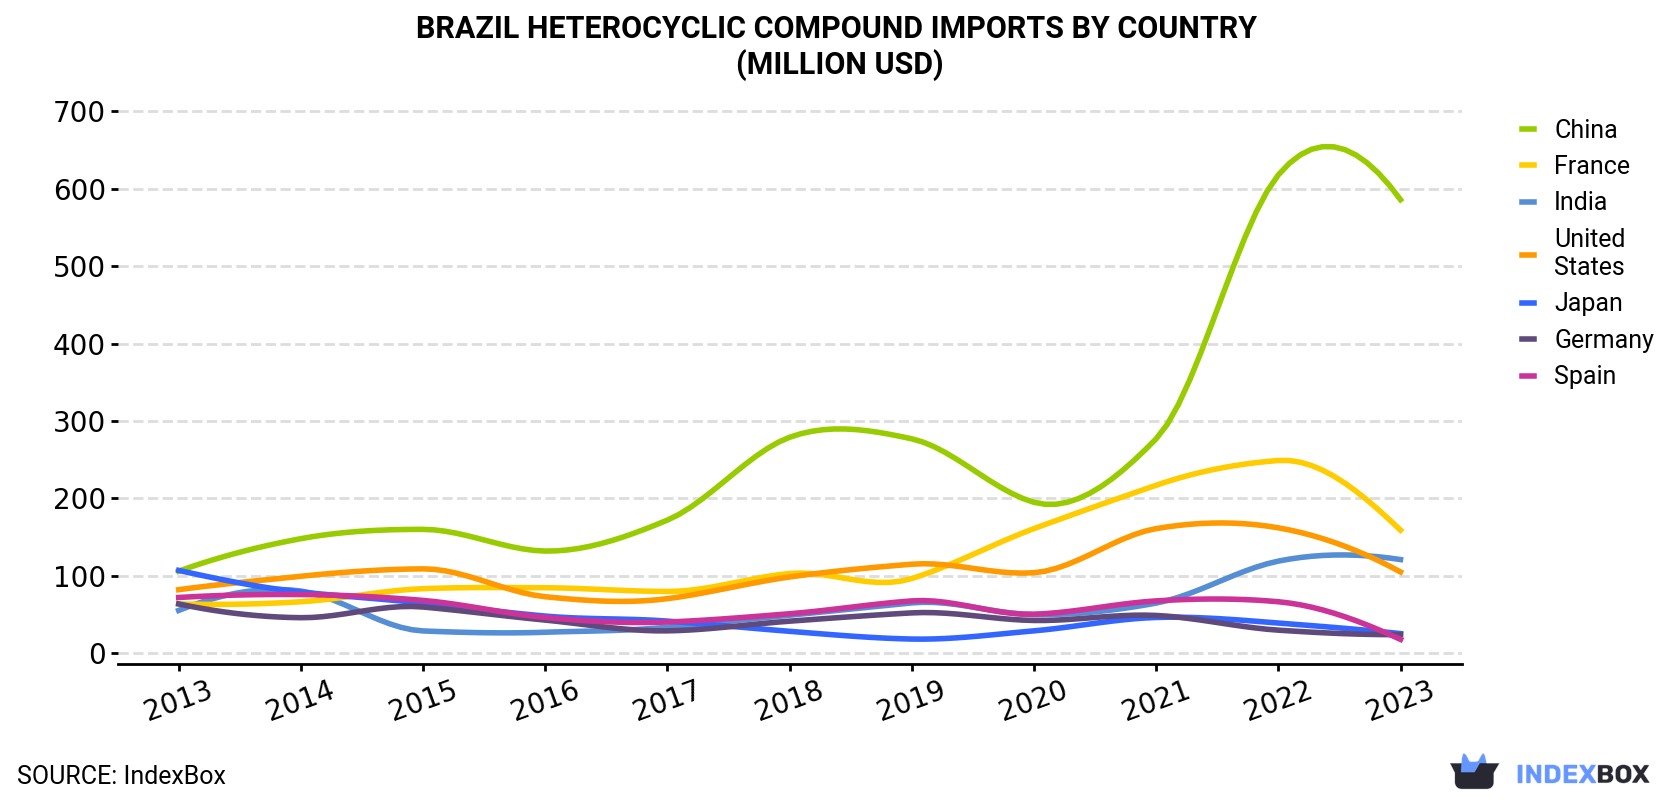
| COUNTRY | Import Value of Heterocyclic Compound in Brazil (million USD) | ||||||||||
|---|---|---|---|---|---|---|---|---|---|---|---|
| 2013 | 2014 | 2015 | 2016 | 2017 | 2018 | 2019 | 2020 | 2021 | 2022 | 2023 | |
| China | 106 | 148 | 160 | 132 | 172 | 279 | 277 | 195 | 277 | 618 | 586 |
| France | 63.7 | 66.5 | 83.4 | 84.6 | 79.8 | 103 | 96.5 | 161 | 217 | 249 | 159 |
| India | 55.3 | 80.3 | 28.8 | 27.1 | 33.6 | 49.1 | 65.0 | 49.9 | 64.8 | 119 | 121 |
| United States | 82.1 | 99.4 | 109 | 73.0 | 70.5 | 98.5 | 115 | 104 | 161 | 162 | 105 |
| Japan | 107 | 79.1 | 64.8 | 48.0 | 41.5 | 28.3 | 18.3 | 28.9 | 46.2 | 39.0 | 25.3 |
| Germany | 63.7 | 45.9 | 59.7 | 42.8 | 28.9 | 41.4 | 52.1 | 42.3 | 48.8 | 29.8 | 24.0 |
| Spain | 72.0 | 75.8 | 68.2 | 46.2 | 40.3 | 51.0 | 67.6 | 50.4 | 67.6 | 66.5 | 17.9 |
| Others | 108 | 104 | 99.8 | 72.1 | 78.6 | 89.5 | 119 | 92.8 | 85.4 | 79.1 | 52.3 |
| Total | 658 | 698 | 674 | 526 | 546 | 740 | 810 | 724 | 968 | 1,363 | 1,091 |
Imports by Country
In 2023, China (17K tons) constituted the largest supplier of heterocyclic compound to Brazil, accounting for a 59% share of total imports. Moreover, heterocyclic compound imports from China exceeded the figures recorded by the second-largest supplier, India (4K tons), fourfold. the United States (2.5K tons) ranked third in terms of total imports with an 8.9% share.
From 2013 to 2023, the average annual growth rate of volume from China amounted to +5.8%. The remaining supplying countries recorded the following average annual rates of imports growth: India (-5.0% per year) and the United States (-1.8% per year).
In value terms, China ($586M) constituted the largest supplier of heterocyclic compounds to Brazil, comprising 54% of total imports. The second position in the ranking was held by France ($159M), with a 15% share of total imports. It was followed by India, with an 11% share.
From 2013 to 2023, the average annual rate of growth in terms of value from China stood at +18.6%. The remaining supplying countries recorded the following average annual rates of imports growth: France (+9.6% per year) and India (+8.2% per year).
Imports by Type
In 2023, heterocyclic compounds; containing an unfused pyridine ring (whether or not hydrogenated) in the structure, other than pyridine and its salts (28K tons) was the main type of heterocyclic compounds supplied to Brazil, accounting for a 100% share of total imports. It was followed by heterocyclic compounds; containing an unfused pyridine ring (whether or not hydrogenated) in the structure, piperidine and its salts (109 tons), with a 0.4% share of total imports. Heterocyclic compounds; containing an unfused pyridine ring (whether or not hydrogenated) in the structure, pyridine and its salts (25 tons) ranked third in terms of total imports with a 0.1% share.
From 2013 to 2023, the average annual growth rate of the volume of heterocyclic compounds; containing an unfused pyridine ring (whether or not hydrogenated) in the structure, other than pyridine and its salts imports amounted to -2.7%. With regard to the other supplied products, the following average annual rates of growth were recorded: heterocyclic compounds; containing an unfused pyridine ring (whether or not hydrogenated) in the structure, piperidine and its salts (+33.3% per year) and heterocyclic compounds; containing an unfused pyridine ring (whether or not hydrogenated) in the structure, pyridine and its salts (-2.0% per year).
In value terms, heterocyclic compounds; containing an unfused pyridine ring (whether or not hydrogenated) in the structure, other than pyridine and its salts ($1.1B) constituted the largest type of heterocyclic compounds supplied to Brazil, comprising 99% of total imports. The second position in the ranking was taken by heterocyclic compounds; containing an unfused pyridine ring (whether or not hydrogenated) in the structure, other than pyridine and its salts, other than piperidine and its salts ($11M), with a 1% share of total imports. It was followed by heterocyclic compounds; containing an unfused pyridine ring (whether or not hydrogenated) in the structure, piperidine and its salts, with a 0.1% share.
Import Prices by Country
In 2023, the heterocyclic compound price amounted to $38,517 per ton (CIF, Brazil), surging by 6.5% against the previous year. Overall, the import price saw a strong expansion. The pace of growth was the most pronounced in 2020 an increase of 82%. The import price peaked in 2023 and is likely to see steady growth in the immediate term.
There were significant differences in the average prices amongst the major supplying countries. In 2023, amid the top importers, the country with the highest price was Spain ($108,271 per ton), while the price for South Korea ($15,296 per ton) was amongst the lowest.
From 2013 to 2023, the most notable rate of growth in terms of prices was attained by the UK (+28.6%), while the prices for the other major suppliers experienced more modest paces of growth.
This report provides an in-depth analysis of the heterocyclic compound market in Brazil. Within it, you will discover the latest data on market trends and opportunities by country, consumption, production and price developments, as well as the global trade (imports and exports). The forecast exhibits the market prospects through 2030.
Product coverage:
- Prodcom 20145280 -
Country coverage:
- Brazil
Data coverage:
- Market volume and value
- Per Capita consumption
- Forecast of the market dynamics in the medium term
- Trade (exports and imports) in Brazil
- Export and import prices
- Market trends, drivers and restraints
- Key market players and their profiles
Reasons to buy this report:
- Take advantage of the latest data
- Find deeper insights into current market developments
- Discover vital success factors affecting the market
This report is designed for manufacturers, distributors, importers, and wholesalers, as well as for investors, consultants and advisors.
In this report, you can find information that helps you to make informed decisions on the following issues:
- How to diversify your business and benefit from new market opportunities
- How to load your idle production capacity
- How to boost your sales on overseas markets
- How to increase your profit margins
- How to make your supply chain more sustainable
- How to reduce your production and supply chain costs
- How to outsource production to other countries
- How to prepare your business for global expansion
While doing this research, we combine the accumulated expertise of our analysts and the capabilities of artificial intelligence. The AI-based platform, developed by our data scientists, constitutes the key working tool for business analysts, empowering them to discover deep insights and ideas from the marketing data.
-
1. INTRODUCTION
Making Data-Driven Decisions to Grow Your Business
- REPORT DESCRIPTION
- RESEARCH METHODOLOGY AND AI PLATFORM
- DATA-DRIVEN DECISIONS FOR YOUR BUSINESS
- GLOSSARY AND SPECIFIC TERMS
-
2. EXECUTIVE SUMMARY
A Quick Overview of Market Performance
- KEY FINDINGS
- MARKET TRENDS This Chapter is Available Only for the Professional Edition PRO
-
3. MARKET OVERVIEW
Understanding the Current State of The Market and Its Prospects
- MARKET SIZE
- MARKET STRUCTURE
- TRADE BALANCE
- PER CAPITA CONSUMPTION
- MARKET FORECAST TO 2030
-
4. MOST PROMISING PRODUCT
Finding New Products to Diversify Your Business
This Chapter is Available Only for the Professional Edition PRO- TOP PRODUCTS TO DIVERSIFY YOUR BUSINESS
- BEST-SELLING PRODUCTS
- MOST CONSUMED PRODUCT
- MOST TRADED PRODUCT
- MOST PROFITABLE PRODUCT FOR EXPORT
-
5. MOST PROMISING SUPPLYING COUNTRIES
Choosing the Best Countries to Establish Your Sustainable Supply Chain
This Chapter is Available Only for the Professional Edition PRO- TOP COUNTRIES TO SOURCE YOUR PRODUCT
- TOP PRODUCING COUNTRIES
- TOP EXPORTING COUNTRIES
- LOW-COST EXPORTING COUNTRIES
-
6. MOST PROMISING OVERSEAS MARKETS
Choosing the Best Countries to Boost Your Exports
This Chapter is Available Only for the Professional Edition PRO- TOP OVERSEAS MARKETS FOR EXPORTING YOUR PRODUCT
- TOP CONSUMING MARKETS
- UNSATURATED MARKETS
- TOP IMPORTING MARKETS
- MOST PROFITABLE MARKETS
7. PRODUCTION
The Latest Trends and Insights into The Industry
- PRODUCTION VOLUME AND VALUE
8. IMPORTS
The Largest Import Supplying Countries
- IMPORTS FROM 2012–2023
- IMPORTS BY COUNTRY
- IMPORT PRICES BY COUNTRY
9. EXPORTS
The Largest Destinations for Exports
- EXPORTS FROM 2012–2023
- EXPORTS BY COUNTRY
- EXPORT PRICES BY COUNTRY
-
10. PROFILES OF MAJOR PRODUCERS
The Largest Producers on The Market and Their Profiles
This Chapter is Available Only for the Professional Edition PRO -
LIST OF TABLES
- Key Findings In 2023
- Market Volume, In Physical Terms, 2012–2023
- Market Value, 2012–2023
- Per Capita Consumption In 2012-2023
- Imports, In Physical Terms, By Country, 2012–2023
- Imports, In Value Terms, By Country, 2012–2023
- Import Prices, By Country Of Origin, 2012–2023
- Exports, In Physical Terms, By Country, 2012–2023
- Exports, In Value Terms, By Country, 2012–2023
- Export Prices, By Country Of Destination, 2012–2023
-
LIST OF FIGURES
- Market Volume, In Physical Terms, 2012–2023
- Market Value, 2012–2023
- Market Structure – Domestic Supply vs. Imports, In Physical Terms, 2012-2023
- Market Structure – Domestic Supply vs. Imports, In Value Terms, 2012-2023
- Trade Balance, In Physical Terms, 2012-2023
- Trade Balance, In Value Terms, 2012-2023
- Per Capita Consumption, 2012-2023
- Market Volume Forecast to 2030
- Market Value Forecast to 2030
- Products: Market Size And Growth, By Type
- Products: Average Per Capita Consumption, By Type
- Products: Exports And Growth, By Type
- Products: Export Prices And Growth, By Type
- Production Volume And Growth
- Exports And Growth
- Export Prices And Growth
- Market Size And Growth
- Per Capita Consumption
- Imports And Growth
- Import Prices
- Production, In Physical Terms, 2012–2023
- Production, In Value Terms, 2012–2023
- Imports, In Physical Terms, 2012–2023
- Imports, In Value Terms, 2012–2023
- Imports, In Physical Terms, By Country, 2023
- Imports, In Physical Terms, By Country, 2012–2023
- Imports, In Value Terms, By Country, 2012–2023
- Import Prices, By Country Of Origin, 2012–2023
- Exports, In Physical Terms, 2012–2023
- Exports, In Value Terms, 2012–2023
- Exports, In Physical Terms, By Country, 2023
- Exports, In Physical Terms, By Country, 2012–2023
- Exports, In Value Terms, By Country, 2012–2023
- Export Prices, By Country Of Destination, 2012–2023


