World - Aluminium Bars, Rods And Profiles - Market Analysis, Forecast, Size, Trends and Insights
Get instant access to more than 2 million reports, dashboards, and datasets on the IndexBox Platform.
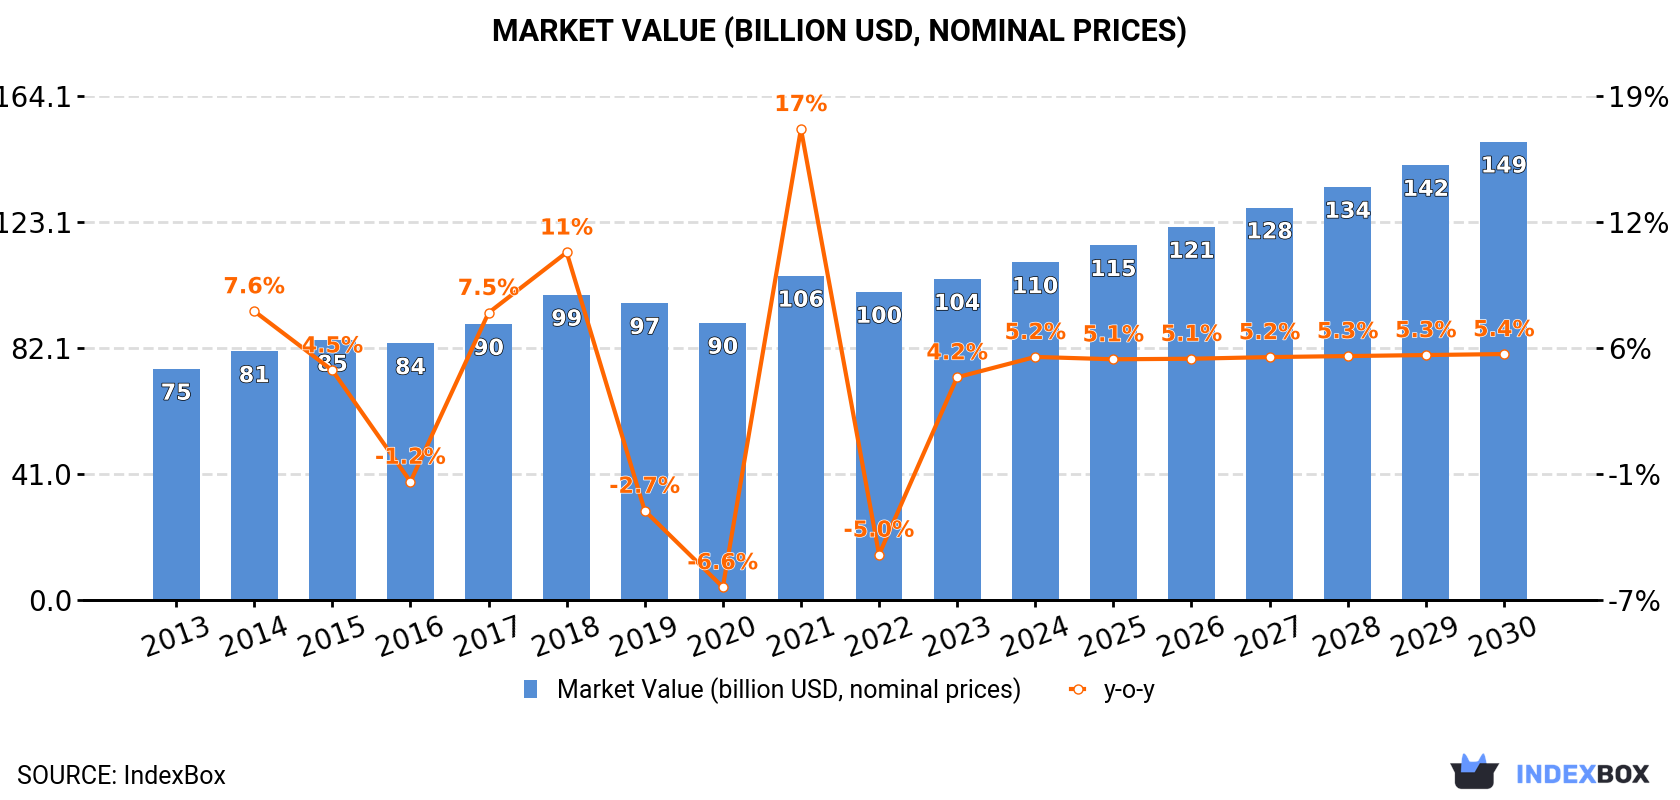
View PricingGlobal Aluminium Bars, Rods, and Profiles Market Expected to Reach $149.2 Billion by 2030 with a CAGR of +5.2%
IndexBox has just published a new report: World - Aluminium Bars, Rods And Profiles - Market Analysis, Forecast, Size, Trends and Insights.
Driven by increasing global demand, the market for aluminium bars, rods, and profiles is expected to grow at a CAGR of +3.1% in volume and +5.2% in value from 2023 to 2030. China, the United States, and Brazil lead in consumption, production, and exports, with notable growth trends observed in various countries. Despite fluctuations, the market shows potential for expansion in the coming years.
Market Forecast
Market Forecast
Driven by increasing demand for aluminium bars, rods and profiles worldwide, the market is expected to continue an upward consumption trend over the next seven-year period. Market performance is forecast to decelerate, expanding with an anticipated CAGR of +3.1% for the period from 2023 to 2030, which is projected to bring the market volume to 30M tons by the end of 2030.
In value terms, the market is forecast to increase with an anticipated CAGR of +5.2% for the period from 2023 to 2030, which is projected to bring the market value to $149.2B (in nominal prices) by the end of 2030.
Consumption
Consumption
Global aluminium bar consumption expanded modestly to 24M tons in 2023, growing by 2.6% against the year before. The total consumption volume increased at an average annual rate of +4.0% from 2013 to 2023; however, the trend pattern indicated some noticeable fluctuations being recorded throughout the analyzed period. Global consumption peaked at 25M tons in 2021; however, from 2022 to 2023, consumption remained at a lower figure.
The global aluminium bar market revenue rose modestly to $104.4B in 2023, surging by 4.2% against the previous year. This figure reflects the total revenues of producers and importers (excluding logistics costs, retail marketing costs, and retailers' margins, which will be included in the final consumer price). The market value increased at an average annual rate of +3.3% from 2013 to 2023; however, the trend pattern indicated some noticeable fluctuations being recorded throughout the analyzed period. As a result, consumption reached the peak level of $105.5B. From 2022 to 2023, the growth of the global market remained at a lower figure.
Consumption By Country
The countries with the highest volumes of consumption in 2023 were China (5.6M tons), the United States (3.1M tons) and Brazil (1.6M tons), with a combined 43% share of global consumption.
From 2013 to 2023, the biggest increases were recorded for Brazil (with a CAGR of +13.7%), while consumption for the other global leaders experienced more modest paces of growth.
In value terms, the largest aluminium bar markets worldwide were China ($19B), the United States ($16.2B) and Japan ($9.5B), with a combined 43% share of the global market. Germany, Italy, Russia, Indonesia, France, Brazil, Thailand and Iran lagged somewhat behind, together accounting for a further 19%.
In terms of the main consuming countries, Italy, with a CAGR of +6.2%, saw the highest rates of growth with regard to market size over the period under review, while market for the other global leaders experienced more modest paces of growth.
The countries with the highest levels of aluminium bar per capita consumption in 2023 were Italy (13 kg per person), Japan (12 kg per person) and Germany (10 kg per person).
From 2013 to 2023, the biggest increases were recorded for Brazil (with a CAGR of +12.9%), while consumption for the other global leaders experienced more modest paces of growth.
Production
Production
In 2023, the amount of aluminium bars, rods and profiles produced worldwide expanded slightly to 25M tons, increasing by 2.7% against 2022 figures. The total output volume increased at an average annual rate of +4.1% over the period from 2013 to 2023; however, the trend pattern indicated some noticeable fluctuations being recorded in certain years. The most prominent rate of growth was recorded in 2014 with an increase of 15%. Over the period under review, global production reached the maximum volume at 25M tons in 2021; however, from 2022 to 2023, production stood at a somewhat lower figure.
In value terms, aluminium bar production expanded to $116.5B in 2023 estimated in export price. Overall, the total production indicated a remarkable increase from 2013 to 2023: its value increased at an average annual rate of +5.2% over the last decade. The trend pattern, however, indicated some noticeable fluctuations being recorded throughout the analyzed period. Based on 2023 figures, production increased by +25.6% against 2020 indices. The pace of growth was the most pronounced in 2021 when the production volume increased by 31% against the previous year. Global production peaked at $137.7B in 2019; however, from 2020 to 2023, production remained at a lower figure.
Production By Country
China (6.5M tons) constituted the country with the largest volume of aluminium bar production, accounting for 27% of total volume. Moreover, aluminium bar production in China exceeded the figures recorded by the second-largest producer, the United States (2.9M tons), twofold. Brazil (1.6M tons) ranked third in terms of total production with a 6.6% share.
In China, aluminium bar production expanded at an average annual rate of +5.2% over the period from 2013-2023. In the other countries, the average annual rates were as follows: the United States (+5.1% per year) and Brazil (+13.8% per year).
Imports
Imports
In 2023, purchases abroad of aluminium bars, rods and profiles decreased by -6.5% to 4M tons for the first time since 2020, thus ending a two-year rising trend. The total import volume increased at an average annual rate of +2.1% from 2013 to 2023; the trend pattern remained relatively stable, with only minor fluctuations in certain years. The most prominent rate of growth was recorded in 2021 with an increase of 21% against the previous year. Over the period under review, global imports attained the peak figure at 4.3M tons in 2022, and then contracted in the following year.
In value terms, aluminium bar imports shrank to $20.6B in 2023. Over the period under review, total imports indicated notable growth from 2013 to 2023: its value increased at an average annual rate of +4.4% over the last decade. The trend pattern, however, indicated some noticeable fluctuations being recorded throughout the analyzed period. Based on 2023 figures, imports increased by +47.9% against 2020 indices. The growth pace was the most rapid in 2021 when imports increased by 39%. Global imports peaked at $23.6B in 2022, and then shrank in the following year.
Imports By Country
In 2023, Germany (612K tons), distantly followed by the United States (299K tons), France (243K tons) and Belgium (192K tons) were the main importers of aluminium bars, rods and profiles, together mixing up 33% of total imports. The following importers - the Czech Republic (132K tons), Poland (119K tons), the Netherlands (116K tons), the UK (113K tons), Mexico (109K tons), Austria (95K tons), Italy (93K tons), Vietnam (86K tons) and Canada (85K tons) - together made up 24% of total imports.
Imports into Germany increased at an average annual rate of +2.7% from 2013 to 2023. At the same time, Vietnam (+20.1%), Poland (+6.9%), the Czech Republic (+6.8%), the United States (+6.7%), Belgium (+5.8%), Austria (+2.8%), Italy (+2.3%), Canada (+1.5%), the Netherlands (+1.5%) and France (+1.3%) displayed positive paces of growth. Moreover, Vietnam emerged as the fastest-growing importer imported in the world, with a CAGR of +20.1% from 2013-2023. The UK experienced a relatively flat trend pattern. By contrast, Mexico (-4.3%) illustrated a downward trend over the same period. The United States (+2.6 p.p.) and Vietnam (+1.7 p.p.) significantly strengthened its position in terms of the global imports, while Mexico saw its share reduced by -2.5% from 2013 to 2023, respectively. The shares of the other countries remained relatively stable throughout the analyzed period.
In value terms, Germany ($3.2B) constitutes the largest market for imported aluminium bars, rods and profiles worldwide, comprising 16% of global imports. The second position in the ranking was held by the United States ($1.6B), with a 7.7% share of global imports. It was followed by France, with a 7% share.
From 2013 to 2023, the average annual rate of growth in terms of value in Germany stood at +5.5%. The remaining importing countries recorded the following average annual rates of imports growth: the United States (+8.9% per year) and France (+3.6% per year).
Import Prices By Country
In 2023, the average aluminium bar import price amounted to $5,111 per ton, dropping by -6.7% against the previous year. Over the last decade, it increased at an average annual rate of +2.2%. The growth pace was the most rapid in 2022 when the average import price increased by 21% against the previous year. As a result, import price attained the peak level of $5,477 per ton, and then dropped in the following year.
There were significant differences in the average prices amongst the major importing countries. In 2023, amid the top importers, the country with the highest price was the UK ($6,440 per ton), while Belgium ($3,047 per ton) was amongst the lowest.
From 2013 to 2023, the most notable rate of growth in terms of prices was attained by Mexico (+7.6%), while the other global leaders experienced more modest paces of growth.
Exports
Exports
In 2023, the amount of aluminium bars, rods and profiles exported worldwide fell to 4.6M tons, which is down by -5% on the previous year's figure. The total export volume increased at an average annual rate of +2.8% from 2013 to 2023; the trend pattern remained relatively stable, with only minor fluctuations being recorded in certain years. The most prominent rate of growth was recorded in 2021 with an increase of 21%. The global exports peaked at 5M tons in 2015; however, from 2016 to 2023, the exports remained at a lower figure.
In value terms, aluminium bar exports contracted to $23.7B in 2023. Over the period under review, total exports indicated a tangible increase from 2013 to 2023: its value increased at an average annual rate of +4.4% over the last decade. The trend pattern, however, indicated some noticeable fluctuations being recorded throughout the analyzed period. Based on 2023 figures, exports increased by +51.8% against 2020 indices. The most prominent rate of growth was recorded in 2021 with an increase of 42% against the previous year. Over the period under review, the global exports reached the peak figure at $26.8B in 2022, and then dropped in the following year.
Exports By Country
In 2023, China (989K tons), distantly followed by Turkey (385K tons), Spain (323K tons), Germany (298K tons) and Italy (229K tons) were the main exporters of aluminium bars, rods and profiles, together creating 48% of total exports. The following exporters - the United States (157K tons), the Netherlands (156K tons), Poland (134K tons), Belgium (121K tons), Greece (120K tons), Austria (115K tons), Malaysia (105K tons) and Romania (87K tons) - together made up 22% of total exports.
Exports from China increased at an average annual rate of +4.9% from 2013 to 2023. At the same time, Turkey (+10.3%), Greece (+7.7%), Poland (+7.3%), Malaysia (+5.9%), the Netherlands (+5.6%), Spain (+5.2%), Italy (+2.8%), Romania (+2.8%), Germany (+2.4%) and Belgium (+1.9%) displayed positive paces of growth. Moreover, Turkey emerged as the fastest-growing exporter exported in the world, with a CAGR of +10.3% from 2013-2023. By contrast, the United States (-1.8%) and Austria (-1.9%) illustrated a downward trend over the same period. From 2013 to 2023, the share of Turkey and China increased by +4.2 and +3.9 percentage points, respectively. The shares of the other countries remained relatively stable throughout the analyzed period.
In value terms, the largest aluminium bar supplying countries worldwide were China ($3.4B), Germany ($2.4B) and Turkey ($1.9B), together accounting for 33% of global exports.
In terms of the main exporting countries, Turkey, with a CAGR of +11.9%, saw the highest growth rate of the value of exports, over the period under review, while shipments for the other global leaders experienced more modest paces of growth.
Export Prices By Country
In 2023, the average aluminium bar export price amounted to $5,132 per ton, dropping by -6.6% against the previous year. Over the last decade, it increased at an average annual rate of +1.5%. The growth pace was the most rapid in 2022 an increase of 21%. As a result, the export price attained the peak level of $5,497 per ton, and then fell in the following year.
Prices varied noticeably by country of origin: amid the top suppliers, the country with the highest price was Germany ($8,151 per ton), while Malaysia ($3,297 per ton) was amongst the lowest.
From 2013 to 2023, the most notable rate of growth in terms of prices was attained by Romania (+4.7%), while the other global leaders experienced more modest paces of growth.
This report provides an in-depth analysis of the global aluminium bar market. Within it, you will discover the latest data on market trends and opportunities by country, consumption, production and price developments, as well as the global trade (imports and exports). The forecast exhibits the market prospects through 2030.
Product coverage:
- Prodcom 24422230 - Aluminium bars, rods and profiles (excluding rods and profiles prepared for use in structures)
- Prodcom 24422250 - Aluminium alloy bars, rods, profiles and hollow profiles (excluding rods and profiles prepared for use in structures)
Country coverage:
Worldwide - the report contains statistical data for 200 countries and includes detailed profiles of the 50 largest consuming countries:
- USA
- China
- Japan
- Germany
- United Kingdom
- France
- Brazil
- Italy
- Russian Federation
- India
- Canada
- Australia
- Republic of Korea
- Spain
- Mexico
- Indonesia
- Netherlands
- Turkey
- Saudi Arabia
- Switzerland
- Sweden
- Nigeria
- Poland
- Belgium
- Argentina
- Norway
- Austria
- Thailand
- United Arab Emirates
- Colombia
- Denmark
- South Africa
- Malaysia
- Israel
- Singapore
- Egypt
- Philippines
- Finland
- Chile
- Ireland
- Pakistan
- Greece
- Portugal
- Kazakhstan
- Algeria
- Czech Republic
- Qatar
- Peru
- Romania
- Vietnam
+ the largest producing countries
Data coverage:
- Global market volume and value
- Per Capita consumption
- Forecast of the market dynamics in the medium term
- Global production, split by region and country
- Global trade (exports and imports)
- Export and import prices
- Market trends, drivers and restraints
- Key market players and their profiles
Reasons to buy this report:
- Take advantage of the latest data
- Find deeper insights into current market developments
- Discover vital success factors affecting the market
This report is designed for manufacturers, distributors, importers, and wholesalers, as well as for investors, consultants and advisors.
In this report, you can find information that helps you to make informed decisions on the following issues:
- How to diversify your business and benefit from new market opportunities
- How to load your idle production capacity
- How to boost your sales on overseas markets
- How to increase your profit margins
- How to make your supply chain more sustainable
- How to reduce your production and supply chain costs
- How to outsource production to other countries
- How to prepare your business for global expansion
While doing this research, we combine the accumulated expertise of our analysts and the capabilities of artificial intelligence. The AI-based platform, developed by our data scientists, constitutes the key working tool for business analysts, empowering them to discover deep insights and ideas from the marketing data.
-
1. INTRODUCTION
Making Data-Driven Decisions to Grow Your Business
- REPORT DESCRIPTION
- RESEARCH METHODOLOGY AND AI PLATFORM
- DATA-DRIVEN DECISIONS FOR YOUR BUSINESS
- GLOSSARY AND SPECIFIC TERMS
-
2. EXECUTIVE SUMMARY
A Quick Overview of Market Performance
- KEY FINDINGS
- MARKET TRENDS This Chapter is Available Only for the Professional Edition PRO
-
3. MARKET OVERVIEW
Understanding the Current State of The Market and Its Prospects
- MARKET SIZE
- CONSUMPTION BY COUNTRY
- MARKET FORECAST TO 2030
-
4. MOST PROMISING PRODUCT
Finding New Products to Diversify Your Business
This Chapter is Available Only for the Professional Edition PRO- TOP PRODUCTS TO DIVERSIFY YOUR BUSINESS
- BEST-SELLING PRODUCTS
- MOST CONSUMED PRODUCT
- MOST TRADED PRODUCT
- MOST PROFITABLE PRODUCT FOR EXPORT
-
5. MOST PROMISING SUPPLYING COUNTRIES
Choosing the Best Countries to Establish Your Sustainable Supply Chain
This Chapter is Available Only for the Professional Edition PRO- TOP COUNTRIES TO SOURCE YOUR PRODUCT
- TOP PRODUCING COUNTRIES
- TOP EXPORTING COUNTRIES
- LOW-COST EXPORTING COUNTRIES
-
6. MOST PROMISING OVERSEAS MARKETS
Choosing the Best Countries to Boost Your Exports
This Chapter is Available Only for the Professional Edition PRO- TOP OVERSEAS MARKETS FOR EXPORTING YOUR PRODUCT
- TOP CONSUMING MARKETS
- UNSATURATED MARKETS
- TOP IMPORTING MARKETS
- MOST PROFITABLE MARKETS
7. GLOBAL PRODUCTION
The Latest Trends and Insights into The Industry
- PRODUCTION VOLUME AND VALUE
- PRODUCTION BY COUNTRY
8. GLOBAL IMPORTS
The Largest Importers on The Market and How They Succeed
- IMPORTS FROM 2012–2023
- IMPORTS BY COUNTRY
- IMPORT PRICES BY COUNTRY
9. GLOBAL EXPORTS
The Largest Exporters on The Market and How They Succeed
- EXPORTS FROM 2012–2023
- EXPORTS BY COUNTRY
- EXPORT PRICES BY COUNTRY
-
10. PROFILES OF MAJOR PRODUCERS
The Largest Producers on The Market and Their Profiles
This Chapter is Available Only for the Professional Edition PRO -
11. COUNTRY PROFILES
The Largest Markets And Their Profiles
This Chapter is Available Only for the Professional Edition PRO- United States
- China
- Japan
- Germany
- United Kingdom
- France
- Brazil
- Italy
- Russian Federation
- India
- Canada
- Australia
- Republic of Korea
- Spain
- Mexico
- Indonesia
- Netherlands
- Turkey
- Saudi Arabia
- Switzerland
- Sweden
- Nigeria
- Poland
- Belgium
- Argentina
- Norway
- Austria
- Thailand
- United Arab Emirates
- Colombia
- Denmark
- South Africa
- Malaysia
- Israel
- Singapore
- Egypt
- Philippines
- Finland
- Chile
- Ireland
- Pakistan
- Greece
- Portugal
- Kazakhstan
- Algeria
- Czech Republic
- Qatar
- Peru
- Romania
- Vietnam
-
LIST OF TABLES
- Key Findings In 2023
- Market Volume, In Physical Terms, 2012–2023
- Market Value, 2012–2023
- Per Capita Consumption, By Country, 2018–2023
- Production, In Physical Terms, By Country, 2012–2023
- Imports, In Physical Terms, By Country, 2012–2023
- Imports, In Value Terms, By Country, 2012–2023
- Import Prices, By Country Of Destination, 2012–2023
- Exports, In Physical Terms, By Country, 2012–2023
- Exports, In Value Terms, By Country, 2012–2023
- Export Prices, By Country Of Origin, 2012–2023
-
LIST OF FIGURES
- Market Volume, In Physical Terms, 2012–2023
- Market Value, 2012–2023
- Consumption, By Country, 2023
- Market Volume Forecast to 2030
- Market Value Forecast to 2030
- Products: Market Size And Growth, By Type
- Products: Average Per Capita Consumption, By Type
- Products: Exports And Growth, By Type
- Products: Export Prices And Growth, By Type
- Production Volume And Growth
- Exports And Growth
- Export Prices And Growth
- Market Size And Growth
- Per Capita Consumption
- Imports And Growth
- Import Prices
- Production, In Physical Terms, 2012–2023
- Production, In Value Terms, 2012–2023
- Production, By Country, 2023
- Production, In Physical Terms, By Country, 2012–2023
- Imports, In Physical Terms, 2012–2023
- Imports, In Value Terms, 2012–2023
- Imports, In Physical Terms, By Country, 2023
- Imports, In Physical Terms, By Country, 2012–2023
- Imports, In Value Terms, By Country, 2012–2023
- Import Prices, By Country, 2012–2023
- Exports, In Physical Terms, 2012–2023
- Exports, In Value Terms, 2012–2023
- Exports, In Physical Terms, By Country, 2023
- Exports, In Physical Terms, By Country, 2012–2023
- Exports, In Value Terms, By Country, 2012–2023
- Export Prices, 2012–2023


